
Fig. 5.
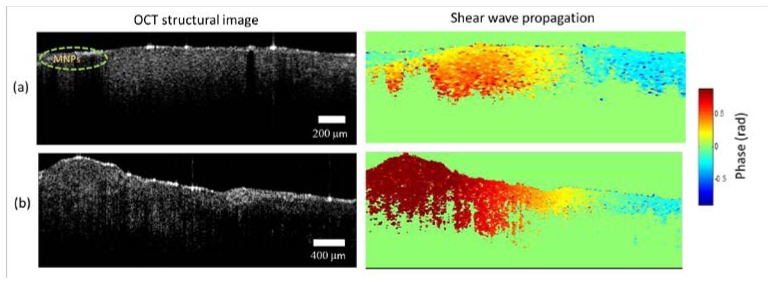
Shear waves in biological tissues. (a) Rat liver tissue. (b) Chicken muscle. OCT structural images (depth range ~1.5 mm) are shown in the first column while the second column shows single frames from the corresponding propagating shear waves videos of rat liver tissue and chicken muscle (Media 3 (6.3MB, AVI) ). The magnetic particle inclusions are on the left side of these images. A line-scan rate of 46 kHz was used with an excitation frequency of 500 Hz consisting of 10 cycles.