
Fig. 4.
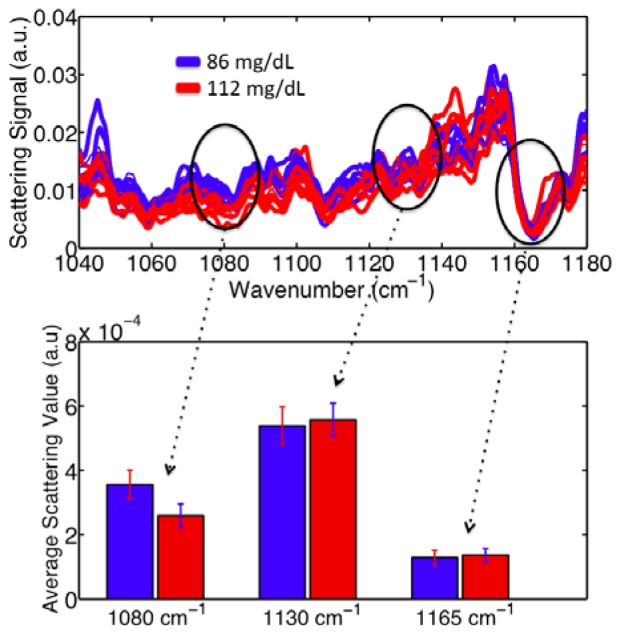
(Top): Ten mid-IR human spectra, each representing 86 mg/dL glucose concentration (blue) and 112 mg/dL glucose concentration (red). (Bottom): Average values for spectra of both concentrations at three specific wavenumbers: 1080, 1130, and 1165 cm−1. At 1080 cm−1, where glucose is expected to absorb, a correlation between attenuation in scattered signal versus increased glucose concentration is observed to beyond a standard deviation. At the other two non glucose-specific wavenumbers, such a correlation was not observed.