
Fig. 5.
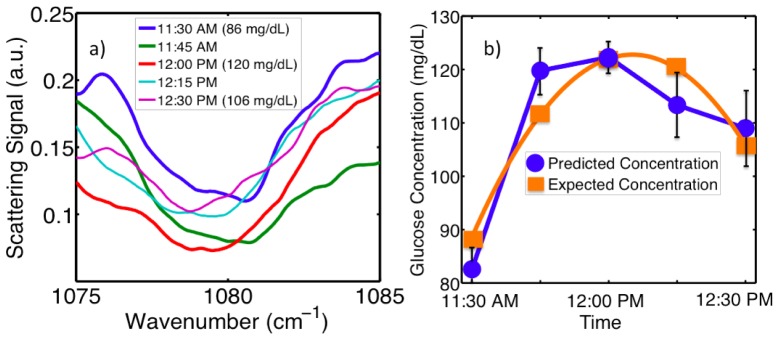
(a): Spectra of backscattered light from a human subject’s palm recorded at equidistant time intervals during a fluctuation of glucose concentration, caused by the consumption of jellybeans. Numerical concentration values were obtained using a commercial monitor. (b): Glucose concentrations predicted from the spectra seen on top plotted versus time, and compared to the curve of measured concentration versus time.