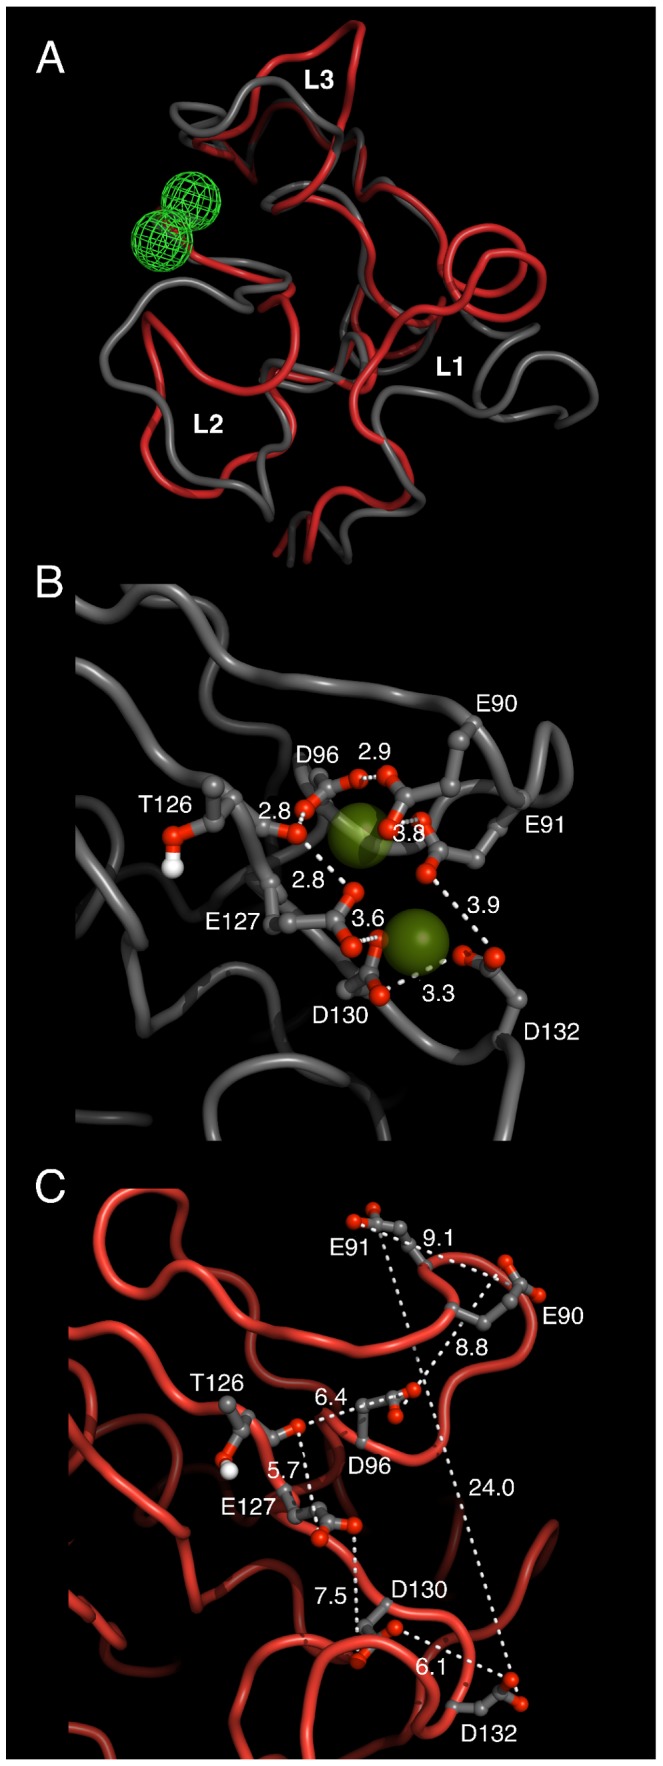
Figure 2. Effect of  binding on ShhN structure.

Structures taken from MD trajectories for Ca2 (grey; based on PDB entry 3d1m with two  ) and Ca0 (red; 1vhh). Shown are sampled structures close to the cluster centers of Ca2 and Ca0 ensembles. (A) Overview and comparison of full ShhN structures in Ca2 and Ca0 states. Position of calcium ions marked by green mesh. Calcium binding pocket formed by loops
  ,
,  breaks up as
  is removed (transition grey to red). Neighboring loop
  is also affected although it does not co-ordinate
  . (B) Close-up of
  (green spheres) binding site in Ca2 state. Calcium ions are surrounded by a cage of anionic side chains. (C) Same region as in panel B, but now in Ca0 state. Note the large distance differences of anionic groups between B and C.
