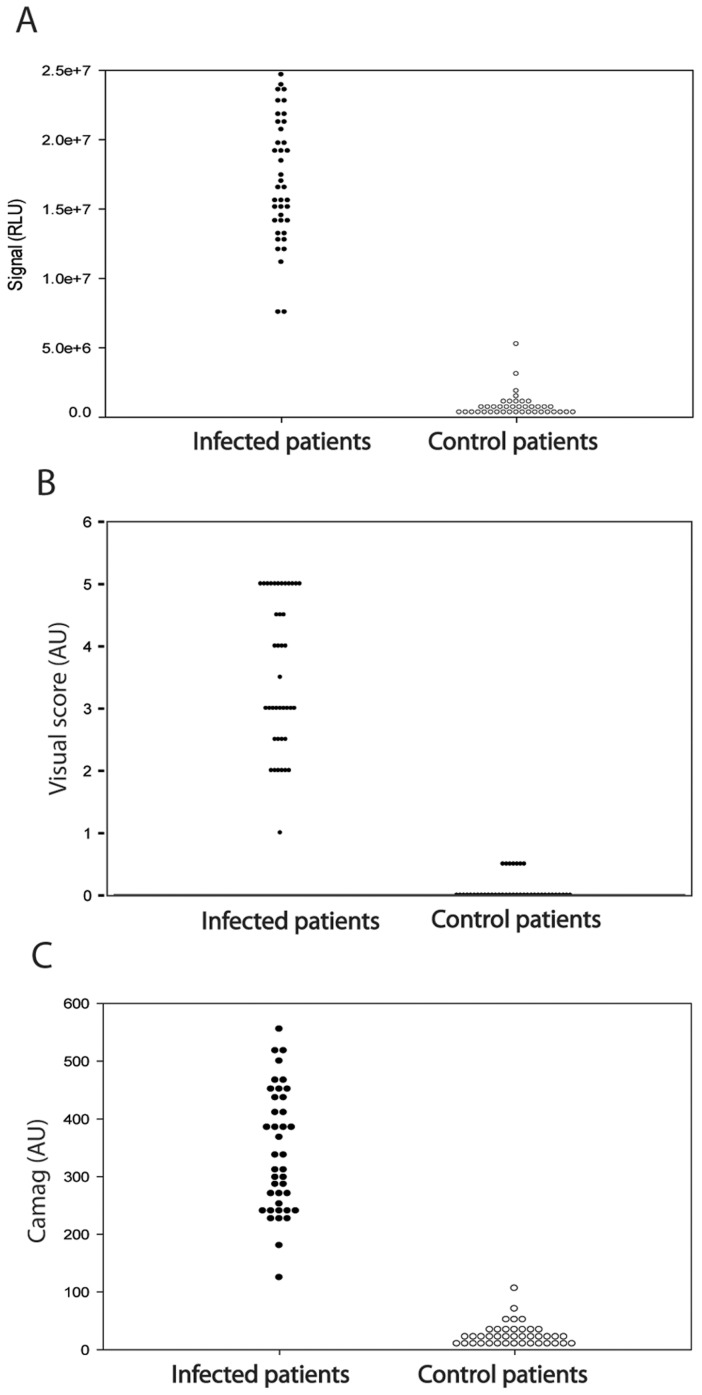
Figure 2. Scatter plots of the immunoreactivities of infection and control sera to sVSG117.
In each plot, data from infection (left) and matched uninfected control (right) sera are plotted against (A) ELISA results, (B) single-antigen LFT results using visual scoring and (C) single-antigen LFT results using Camag laser densitometry scoring.

