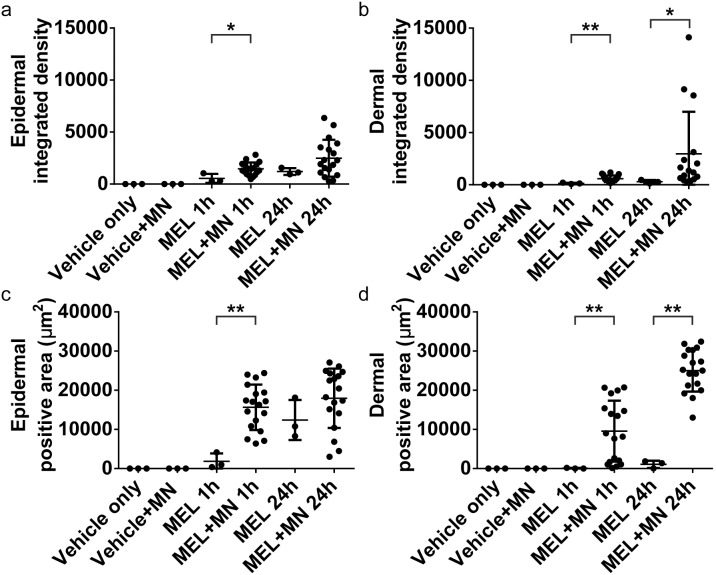
Figure 3. Integrated density and positive area data from melanostatin treated skin.
Melanostatin (MEL) delivery characteristics are shown from epidermal (a and c) and dermal (d and d) mosiacs. Both the integrated density (a and b) and positive area (c and d) are shown for each microneedle site (MN). Data are shown for both 1 and 24 hours peptide exposure (1 h and 24 h, respecitvely). * indicates p<0.05. ** indicates p<0.01.

