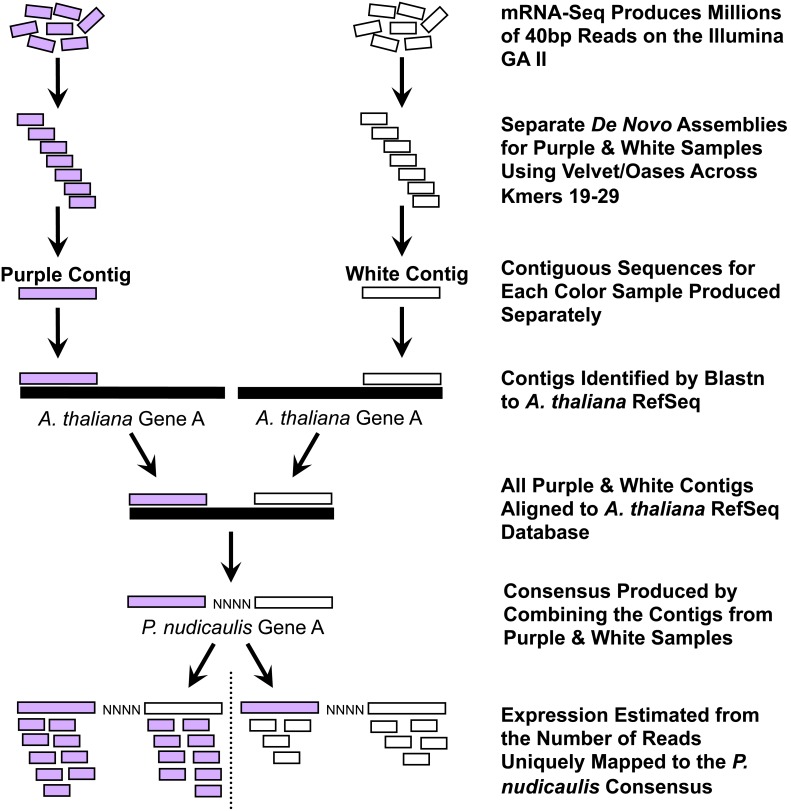
Figure 2. De novo transcriptome analysis pipeline.
A seven-step bioinformatics pipeline for de novo transcriptome analysis of mRNA-Seq data. For each color sample, multiple assemblies using a range of kmer values were conducted separately using Velvet/Oases (not shown). The kmer parameter providing the greatest average contig length per gene for both purple and white was used to create the consensus sequence that became our reference for estimating expression. Expression was measured as reads per kilobase exon per million uniquely mapped reads (RPKM). In the example illustrated, the purple sample has twice the expression of the white sample assuming an equal number of uniquely mapped reads across the entire transcriptome.

