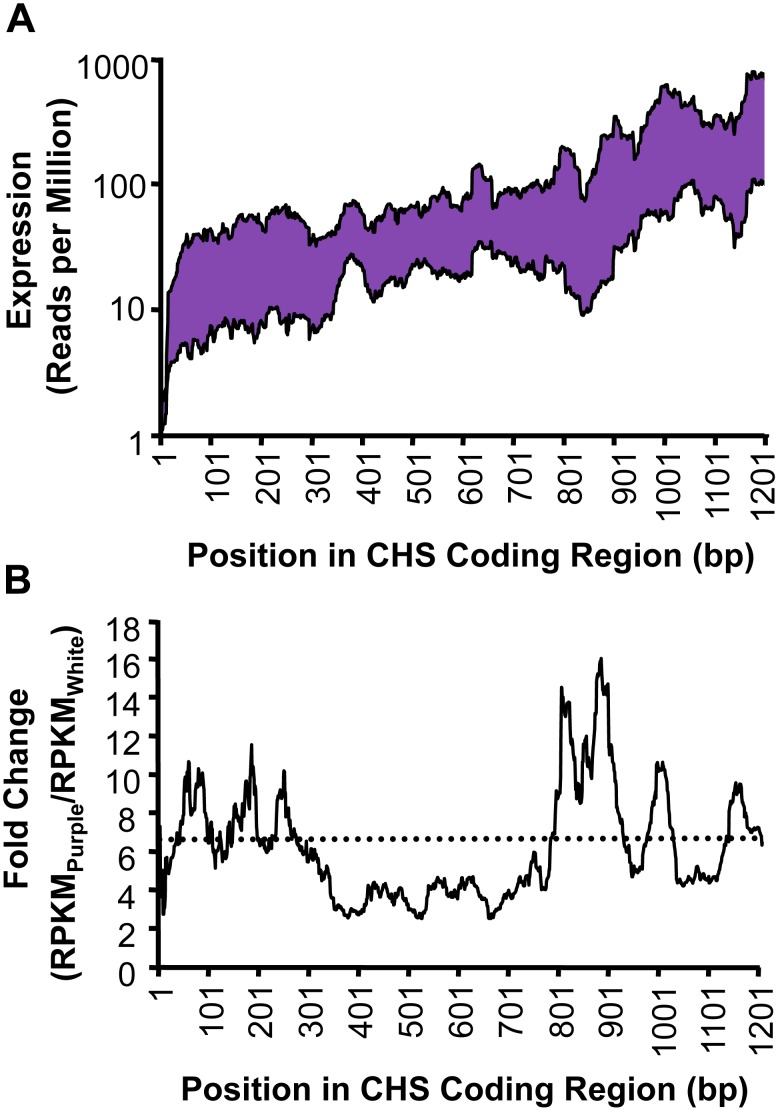
Figure 5. Expression profile for chalcone synthase (CHS).
(A) mRNA-Seq detects substantially higher expression in purple than in white Savage River samples along the entire coding region of CHS. Some 3′-bias is apparent from the increased expression estimates towards the 3′ end of the coding region. (B) A comparison of the purple/white fold-change along the entire coding region of CHS indicates no consistent effect of the 3′-bias on the ratio of purple to white expression. The average fold-change across the gene for the Savage River samples is indicated with a dotted line (P/W = 6.35).

