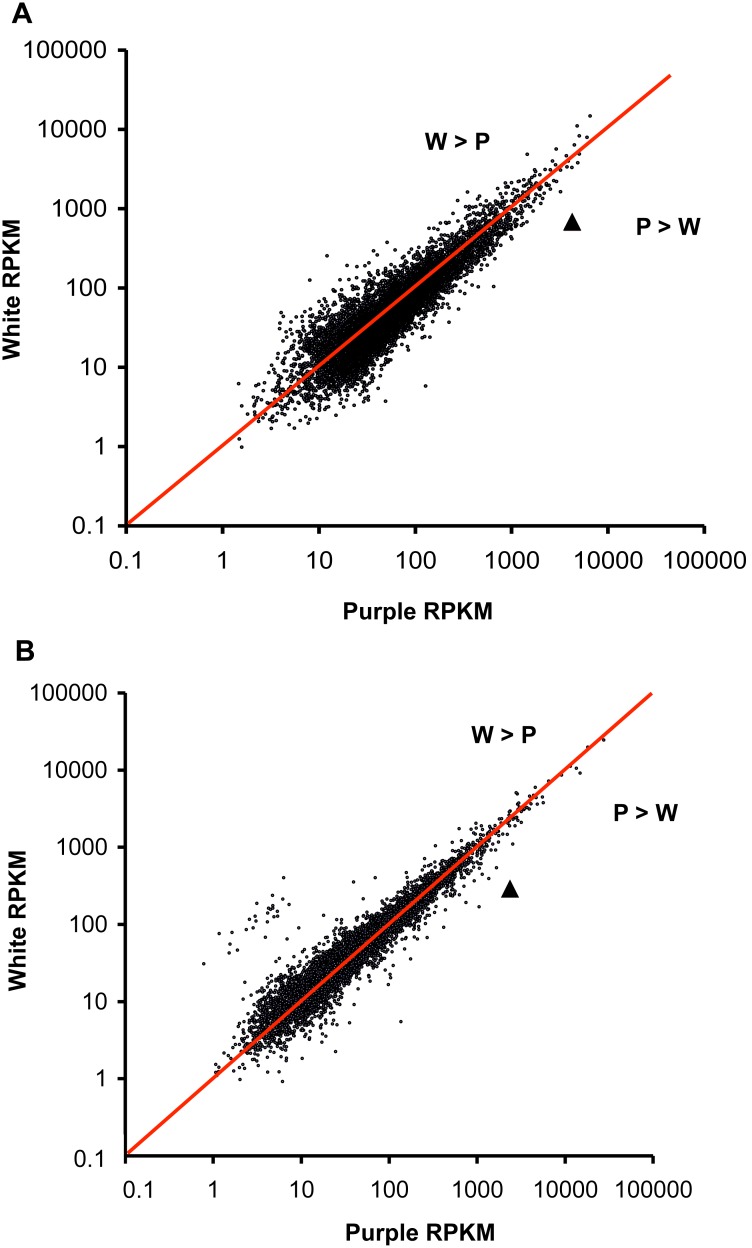
Figure 6. Transcriptome-wide comparison of purple and white expression.
Expression estimates are measured in reads per kilobase exon per million uniquely mapped reads (RPKM). The red line indicates equal expression in purple and white samples. Chalcone synthase is indicated with a triangle. (A) Savage River samples; (B) 12 Mile Summit samples.

