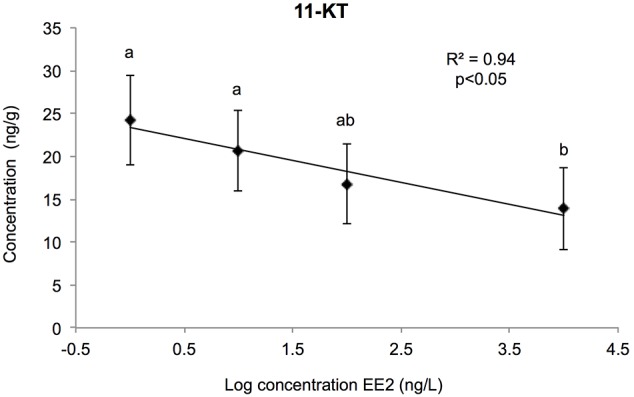
Figure 8. 11-ketosterone levels.

This graph show the linear relationship between [11-ketosterone] and LOG[EE2] in rainbow trout fry gonads submitted chronically to increasing concentrations of EE2. For each group, data represents the mean ± 2 SEM from 6 replicates measured independantly. Each replicate consisted of a pool of 10 pairs of gonads.
