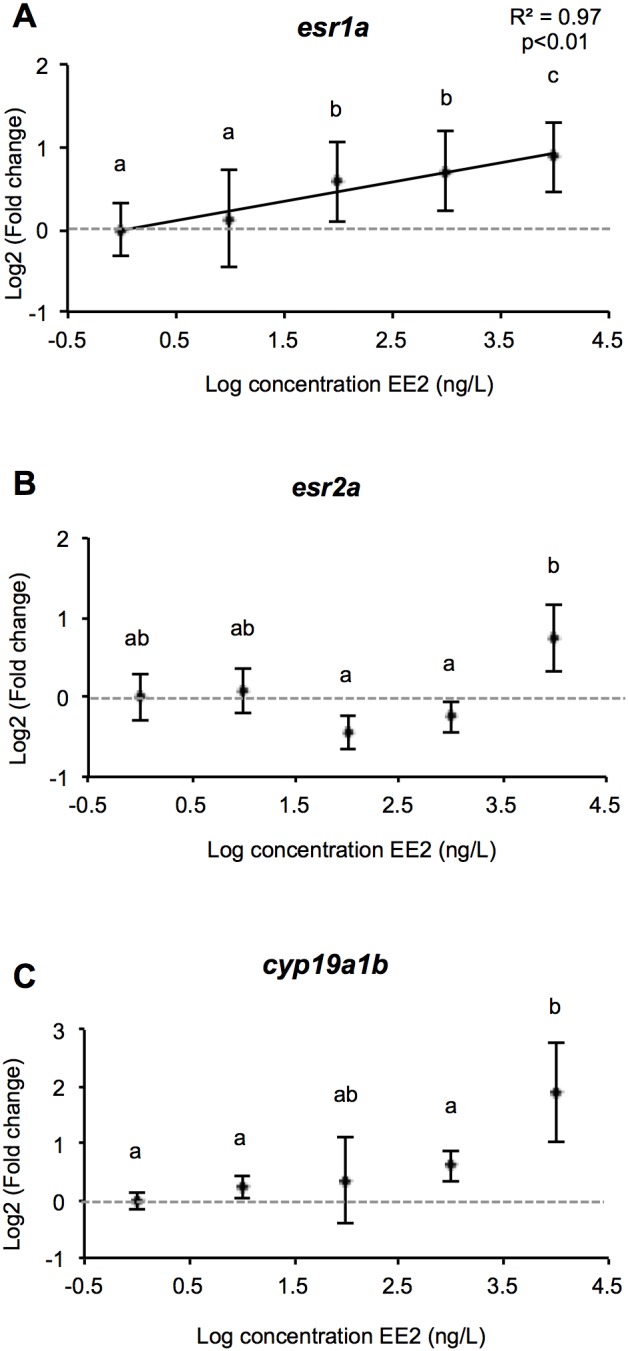
Figure 10. Genes expression profiles in the brain.

Relationship between fold change (expressed as mRNA relative expression ratio with control group) of differentially expressed genes and LOG[EE2] in brains of juvenile male rainbow trout gonads exposed chronically to increasing concentrations of EE2. For each group, data represents the mean ± 2 SEM from 9 replicates measured independantly. Each replicate consisted of a pool of 3 brains. The letters a, b, c summarize the post hoc comparisons (p<0.05), the groups with the same letter being not significantly different. When the lack of fit to linear regression is not significant (p>0.05) the linear regression and associated R2 are shown.
