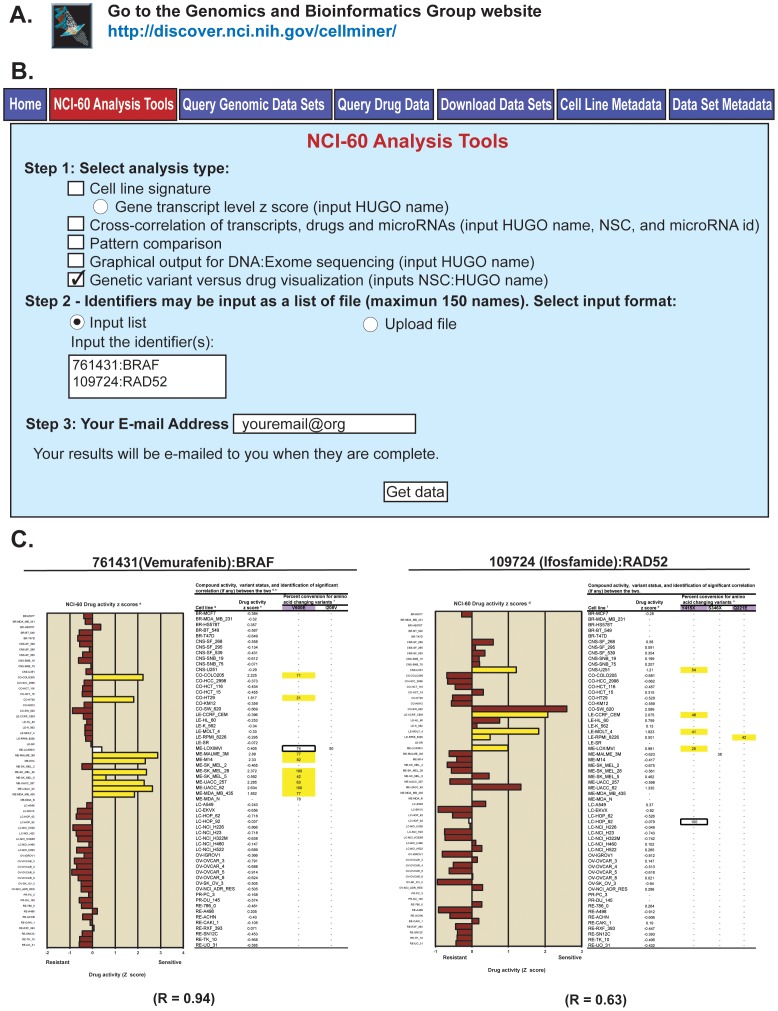
Figure 5. The “Genetic variant versus drug visualization” web-based tool and output examples.
A. The tool is accessed through our CellMiner web-application at http://discover.nci.nih.gov/cellminer/. B. Within the “NCI-60 Analysis Tools” tab (shown in red), the tool is selected by checking the box in Step 1. The compound and gene identifiers (up to 150 pairs) are entered in Step 2, using NSC numbers for the compounds, and HUGO names for the genes. Enter your email address and click “Get data” in Step 3 to receive the output (as an Excel file). C. The output incudes a bar-plot of the compound activity z scores. The x-axis is the activity z scores, and the y-axis the NCI-60 cell lines ordered by tissue of origin. The tabular output includes the cell lines (in column 1), the compound z scores (in column 2), followed by the amino acid changing variants. Cell lines whose activities or variant status contribute to a statistically significant relationship are indicated by yellow coloring. For the bar plot, brown fills indicate cell lines for which no variant correlates with a shift in drug activity, and the white fill that the cell line has a variant correlated to a shift in the drug activity, but that that cell does not contribute to the correlation. For the tabular data, the purple filled in headers indicate the variant(s) that have significant correlation to the compound activity. The white box indicates that the cell line contains a variant that correlates to the compound, but that that cell line has no significant shift in drug activity (that is it is less than plus or minus 0.5 standard deviations from the mean at 0).

