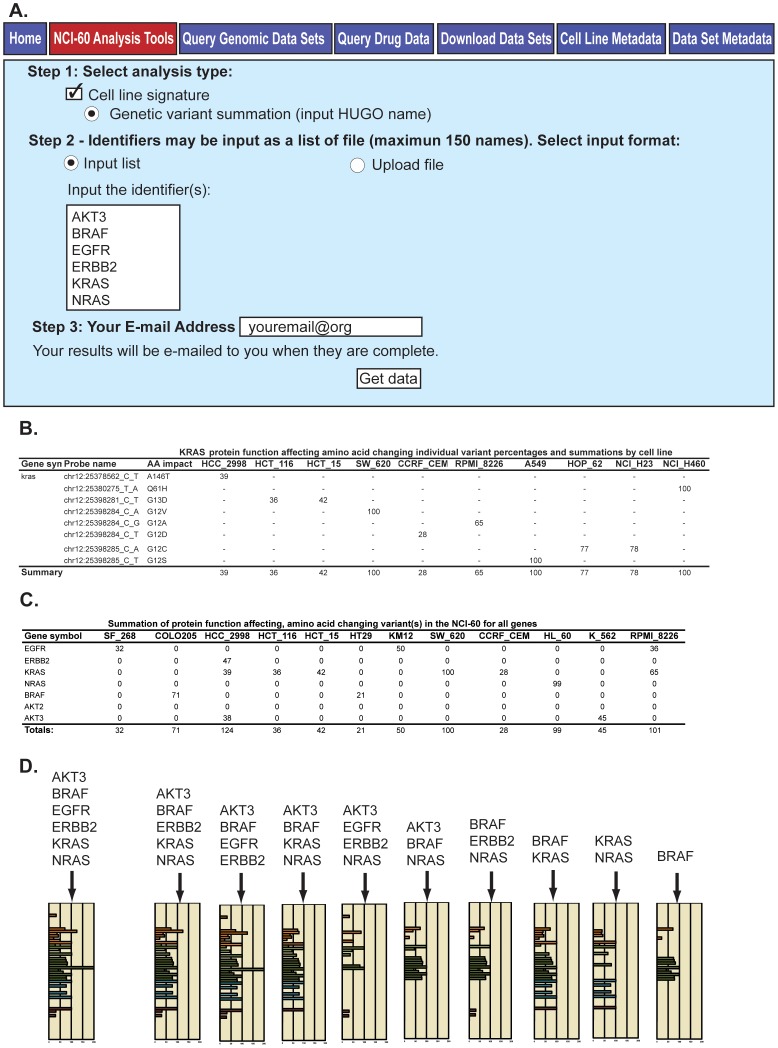
Figure 6. The “Genetic variant summation” tool, and output.
A. The tool is accessed through CellMiner at http://discover.nci.nih.gov/cellminer/, under the “NCI-60 Analysis Tools” tab as described in Figure 5A. The tool is selected in Step 1, and the gene identifiers (up to 150) are entered as HUGO names in Step 2. Enter your email address and click “Get data” in Step 3 to receive the output (as an Excel file). B. The output incudes two versions of the data. The first contains the amino acid changing variants for each input gene. The second contains the subset of these that are included in one of the protein function affecting categories (as defined in Figure 2), and are absent from the non-cancerous 1000 Genomes and ESP5400. Both provide i) chromosome number, ii) nucleotide location and change, iii) amino acid number and change, iv) percent conversion of each cell line for that variant for the NCI-60, and v) the summation of the gene's variants present for each cell line (to a maximum of 100%). The example of KRAS is shown for a subset (due to space constraints) of the cells. C. The tool provides a summation of the variants for all genes in the input. The summary values from B for each gene are added together (with no maximum) to provide a measurement of variant burden (see “Totals”, bottom row). D. The totals from C are used to create a bar graph. The x-axis is the summation of variants values (“Totals” from C). The y-axis is the cell lines, color-coded by tissue of origin [15], [70]. Several outputs are included for illustration, with the first being from the 6-gene input in A.

