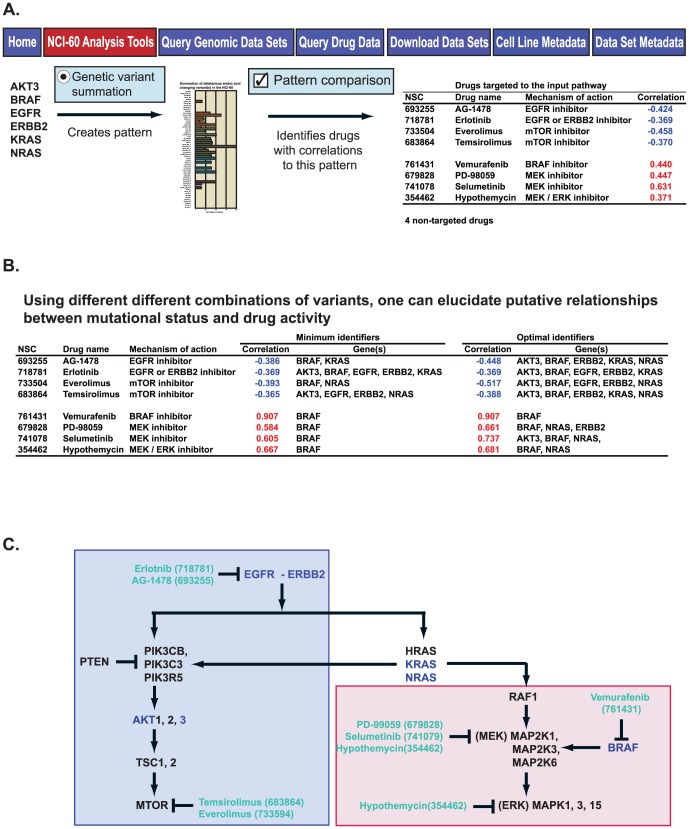
Figure 7. Use of the “Genetic variant summation” tool output for pharmacological exploration.
A. The 6-gene input from Figure 6A yields a summation pattern for the NCI-60. Input of this pattern to the “Pattern comparison” tool [15] identifies 12 significantly correlated drugs with known mechanism-of-action, including 8 that target the input pathway. B. By using the different outputs from the “Genetic variant summation” tool from Figure 6D as inputs to “Pattern comparison”, one may identify the minimum and optimal identifiers for the 8 drugs that target the input pathway. C. The molecular pathway from which the input genes were selected, including the targets of the 8 correlated drugs from A and B. The red-filled and blue-filled boxes indicate the drugs that work better, or worse, respectively, in the presence of the genetic variants from A and B.

