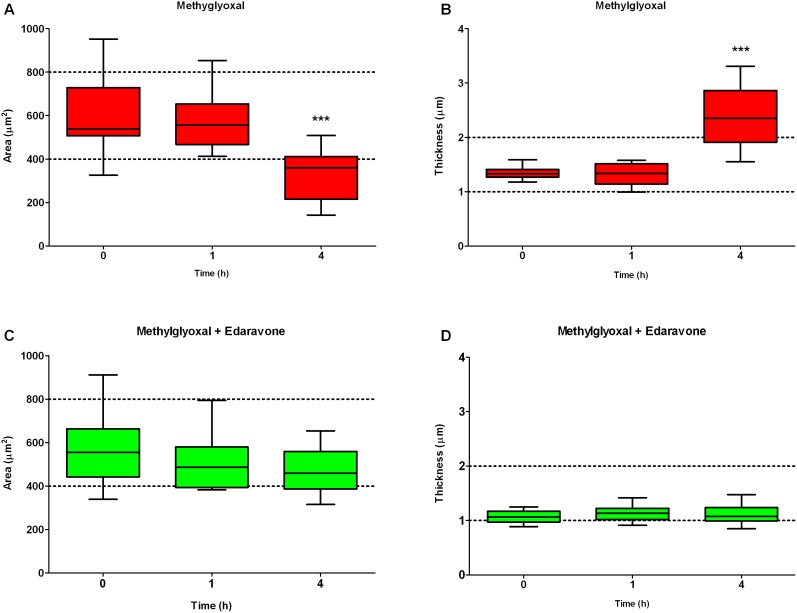
Figure 7. Effect of methylglyoxal and edaravone on area and thickness of adjacent cells.
Morphological alterations induced in human brain endothelial cells (hCMEC/D3) by treatment with methylglyoxal at 600 µM (A and B) and co-treatment with edaravone at 3 mM (C and D) for 4 hours. Surface area (A and C) and average optical thickness (B and D) were calculated before and during treatments. Box represents 25 and 75 percentiles. Horizontal line represent the median. Whiskers show minimum and maximum values. Statistical analysis: ANOVA followed by Dunnett test, n = 12. Statistically significant differences (p<0.05) from 0 time point (*) are indicated.

