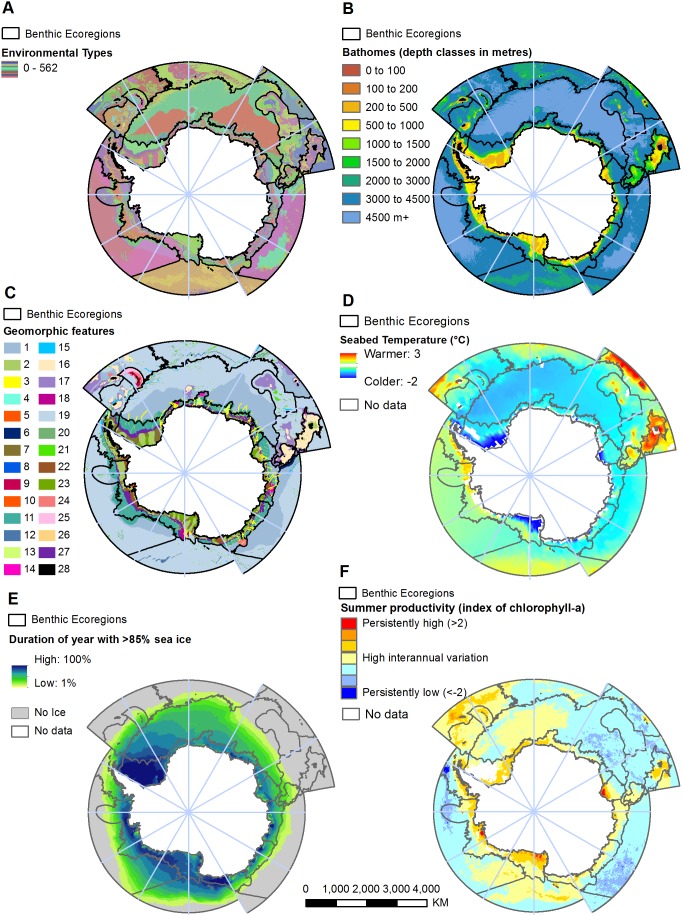
Figure 3. Environmental types and the bio-physical data used to drive the classification.
A) The 562 environmental types (in colour) and ecoregion outlines (refer to figure 2 for names) broadly reflect the underlying data used within the classification B) Bathomes derived from bathymetry and species-depth relationships C) Geomorphic features; Abyssal Plain (1), Bank (2), Canyon (3), Cliff (4), Coastal (rugged) Terrane (5), Contourite Drift (6), Cross Shelf Valley (7), Fracture Zone (8), Island Arc (9), Island Coastal Terrane (10), Lower Slope (11), Marginal Ridge (12), Marginal Plateau (13), Mid-Ocean Ridge Rift Valley (14), Ocean Trough (15), Plateau (16), Plateau Slope (17), Ridge (18), Rugose Ocean Floor (19), Seamount Ridges (20), Seamount (21), Shelf (22), Shelf Deep (Depressions) (23), Structural Slope Region (24), Trench (25), Trough Mouth Fans (26), Upper (Continental) Slope (27), Volcano (28) D) Seabed temperature E) Duration of the year where more than 85% of the region is covered by sea ice F) High positive and negative values indicate areas of consistently high and low summer productivity respectively. Values approaching zero indicate areas that vary greatly between years.

