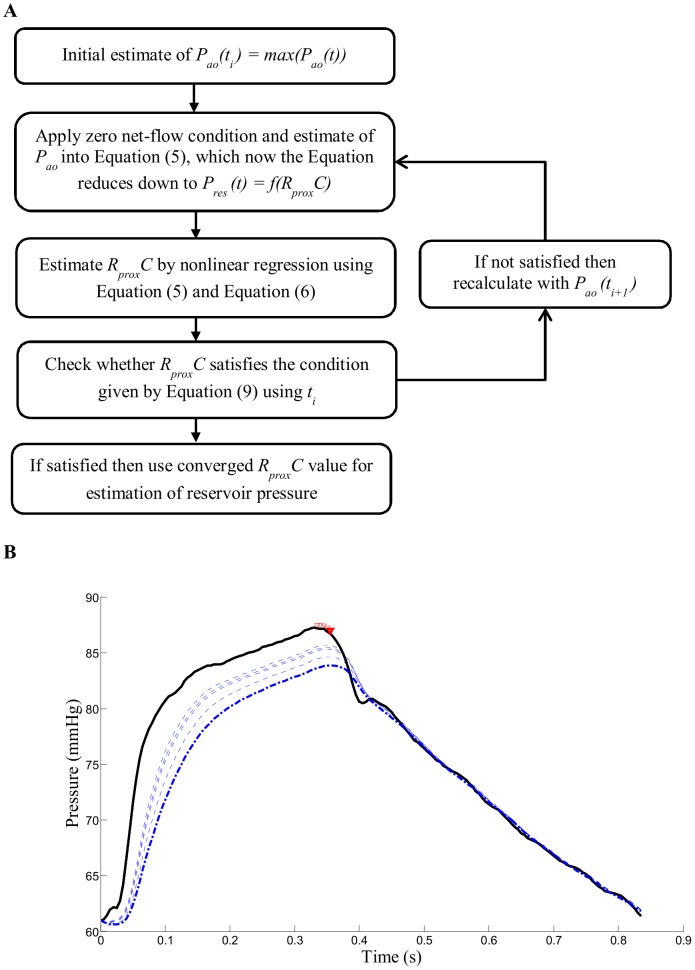
Figure 2. Reservoir pressure estimation process.
A) flow chart showing iteration steps involved for identification of RproxC. B) graph showing measured Pao (thick solid black line), Pao(ti) value used at each iteration (red triangle points), and reservoir approximation through each iteration (thin blue dashed line) and final computed reservoir pressure using converged RproxC (thick blue dashed line).

