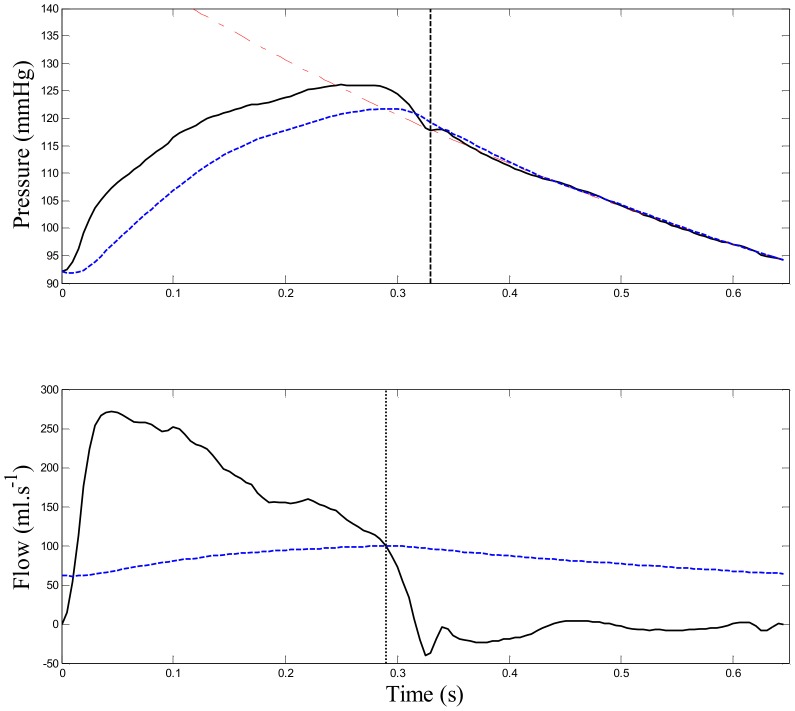
Figure 3. Example of computed reservoir pressure and aortic flow pattern.
Top panel: example of aortic pressure separation showing estimated diastolic curve (red dash-dot line), reservoir pressure Pres (blue dashed line), valve closure time td (dashed black line), and measured aortic pressure Pao (solid black line). Bottom panel: Estimated aortic inflow Qin (solid black line), outflow Qout (dashed blue line), and zero net flow time τ (dotted black line).

