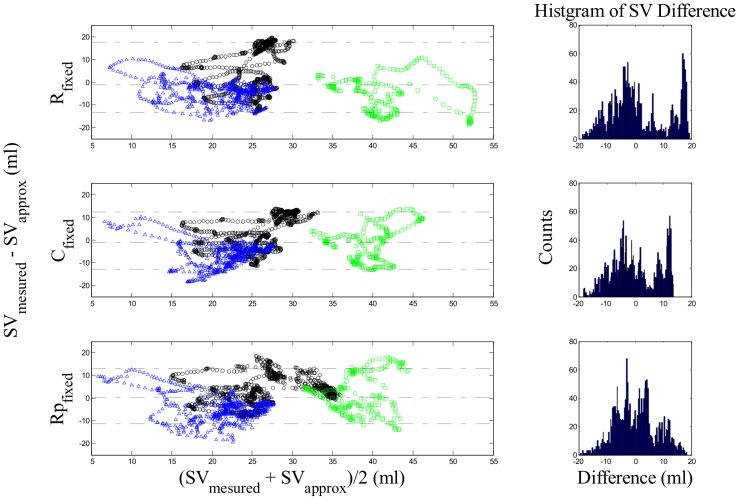
Figure 5. Bland-Altman plots comparing agreements between measured and estimated SV for all pigs using estimated population-representative values in Table 2 (Black circle: pig1, Blue triangle: pig2, Green square: pig3).
Top Panel: Agreements of SV estimation using Rfixed value in Equation (11). Middle Panel: Agreements of SV estimation using Cfixed value in Equation (12). Bottom Panel: Agreements of SV estimation using Rprox, fixed value in Equation (13).

