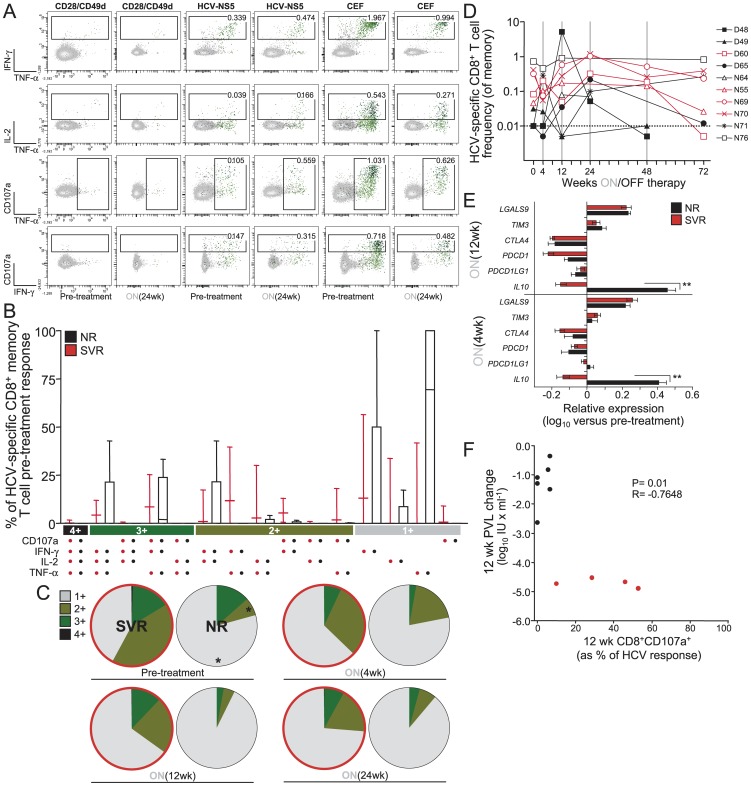
Figure 3. Differences in functional phenotype of the HCV-specific CD8 responses during therapy between SVRs and NRs.
(A) Pre- and on-treatment FACS density plots in response to a 5.5 hour incubation with 2 µgml−1 of HCV NS5 peptide pools showing the frequencies of memory CD8+ T cells displaying the depicted combinations of CD107a mobilizing and intracellular production of IFNγ, IL-2, and TNF-α for patient P70. Gating was done on viable memory CD14−CD19−CD3+CD4−CD8+ cells that were not CD27+CD45RO−. Background activity against CD28/CD49d costimulation alone has been subtracted. (B) Flow cytometric analysis of polyfunctionality within total genotype 1 HCV-specific CD8 memory T-cells is shown at pre-treatment prior to start of therapy. The bar chart shows each of the 15 possible response profiles on the x-axis as the percentage of the total cytokine response on the y-axis. The filled bar represent the interquartile range and the line the median. (C) Summary of functional profile in SVR (red outline) and NR during treatment. The distinct cellular subsets shown in panel B were grouped by number of functions, so each section of the pie charts represent the mean proportion of HCV-specific CD8+ T cells grouped by the number of functions expressed independently of any particular function and matching the color code used in panel B. Statistically significant differences at pre-treatment between SVRs an NRs (*P<0.05, by Mann Whitney test) are indicated by the asterix. (D) The frequency of total HCV-specific CD8 memory T-cell responses at pre-treatment (week 0) and during treatment is shown in each individual as a percentage of their total memory CD8 T-cell population. (E) pegIFN-induced breakdown of the immunosuppressive environment is similar in nonresponders versus responders. Relative levels of immune suppressive genes in PBMCs of NRs (black) and SVRs (red), normalized to pretreatment levels, as determined by qPCR. Error bars represent mean ± SEM (Bonferoni's One-way Anova post-test, **P<0.001). (F) Relationship between the proportion of CD107a mobilization on HCV-specific CD8+ T cells at 12 weeks after treatment initiation and the 12-week treatment changes of PVL from pre-treatment (n = 10, analyzed using Pearson correlation). Each symbol corresponds to one subject: SVRs are in red, NRs are in black.

