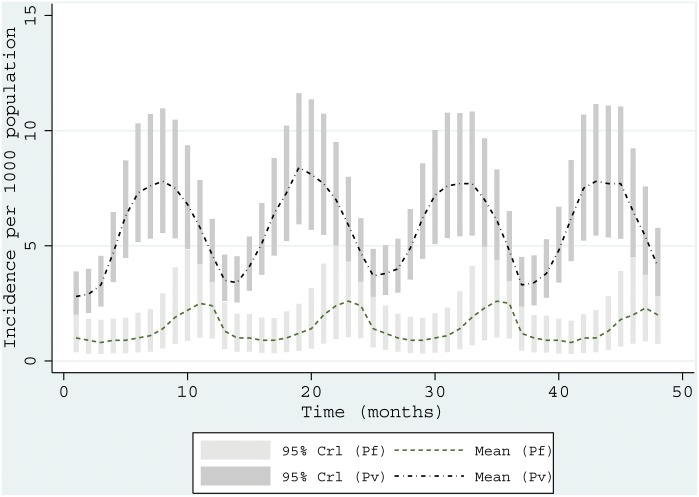
Figure 1. Time series of two malaria parasites.
Plots showing the predicted monthly (n = 48 months) incidence for (2006–2009) for P. vivax (mean as top dash-dot line) and for P. falciparum (mean as green dash line) with error bars for each moth showing 95% Bayesian credible interval (Crl). P. vivax formed the most burden in Afghanistan and its incidence peaked in July and August compared to P. falciparum that peaked later in the year in November.

