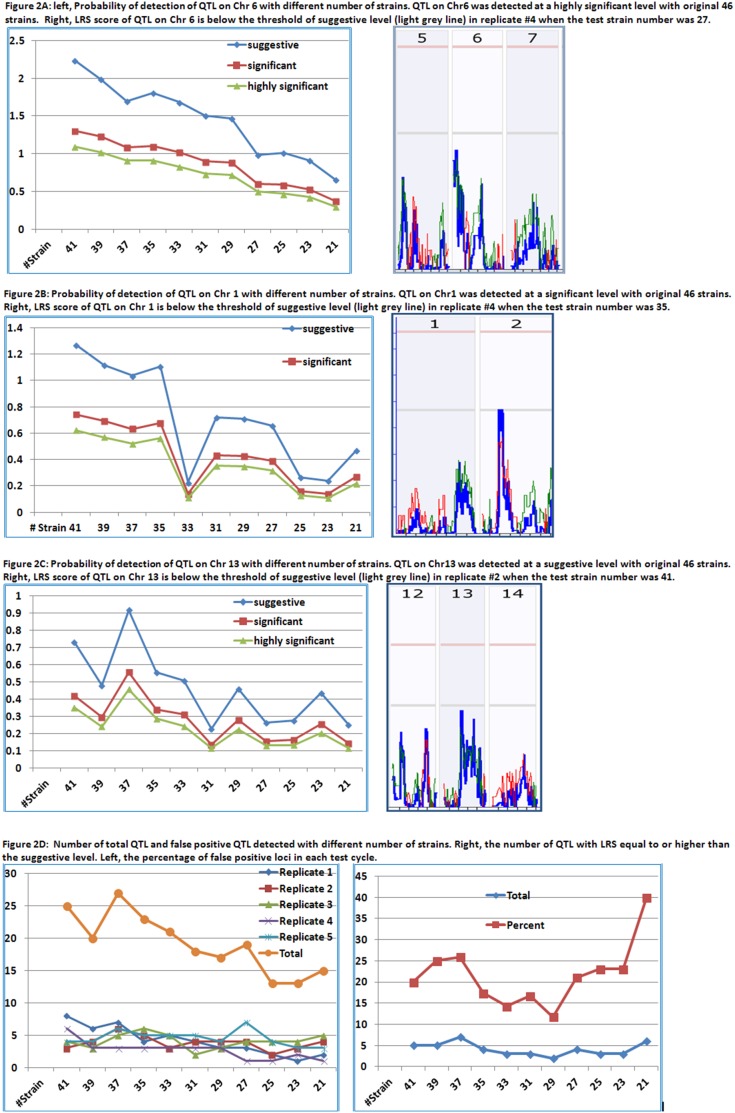
Figure 2. Probability of detection of QTL of TNFα cytokine expression levels with different number of strains.
Y-axis indicates the Probability of QTL detection (Pd). X-axis indicates the number of RI strains in the test of Pd. Figure 2A: Pd of QTL on Chr 6 with different number of strains. QTL on Chr6 was detected at a highly significant level with original 46 strains. Figure 2B: Pd of QTL on Chr 1 with different number of strains. QTL on Chr1 was detected at a significant level with original 46 strains. Figure 2C: Pd of QTL on Chr 13 with different number of strains. QTL on Chr13 was detected at a suggestive level with original 46 strains. Figure 2D. Rate of false positive QTL on Chr 17 as a major QTL detected from tests of different number of strains.

