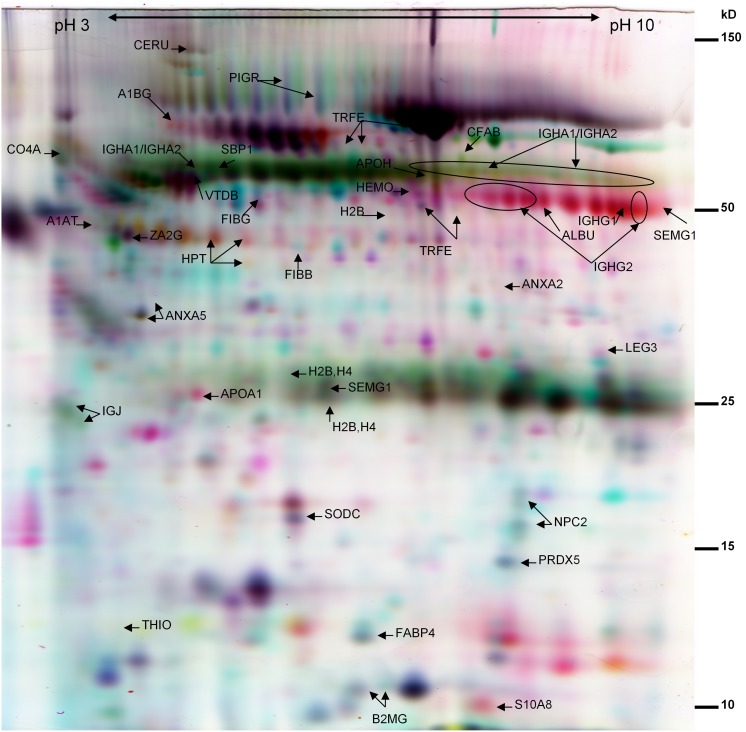
Figure 1. The false color image of two-dimensional DIGE gel of BAL.
The gel image represents the Cy3 labeled (red), Cy5 labeled (blue) and Cy2 labeled (yellow) patient samples. The latter is a pooled sample, which served as an internal standard. Spot abbreviations refer to the identified proteins listed in Table S1. Molecular weights are shown on the right edge of the gel and the pI range on the top part of the SDS-PAGE.

