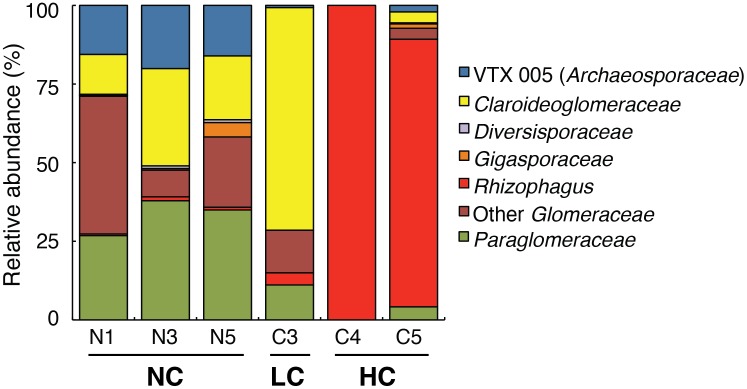
Figure 2. Mean relative abundance of AMF families from all samples in the uncontaminated blocks (N1, N3, N5; n = 12 per block), the moderately contaminated block (C3; n = 12), and the highly contaminated blocks (C4, C5; n = 3 per block).
Labels underneath block numbers indicate no hydrocarbon contamination (NC), low hydrocarbon contamination (LC), and high hydrocarbon contamination (HC).

