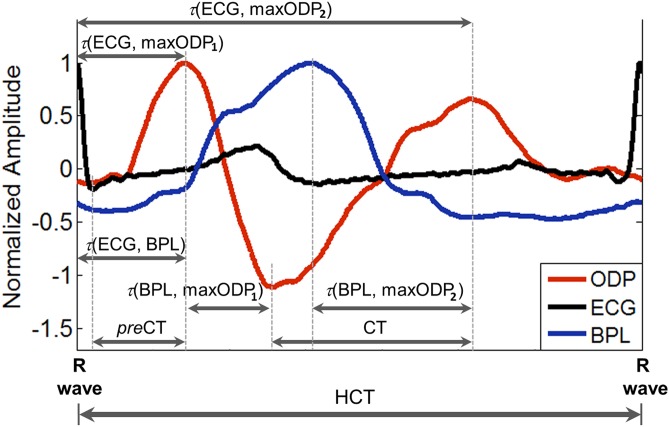
Figure 1. Illustration of typical averaged shapes of ODP, BPL and ECG signals for patient with PACG.
The shapes of presented signals were averaged for one heart cycle and the considered signal parameters are following: τ(ECG, BPL) – time delay between R wave peak of ECG and systolic BPL peak; τ(ECG, maxODP1) – time delay between R wave peak of ECG and the first major ODP maximum; τ(ECG, maxODP2) – time delay between R wave peak of ECG and the second major ODP maximum; τ(BPL, maxODP1) – time delay between systolic BPL peak and the first major ODP maximum; τ(BPL, maxODP2) – time delay between systolic BPL peak and the second major ODP maximum; preCT – preliminary crest time - time taken from minimum to the first major maximum of ODP shape; CT – crest time - time taken from minimum to maximum of ODP shape; HCT – time duration of heart cycle, taken from R peak to the next R peak of ECG shape.

