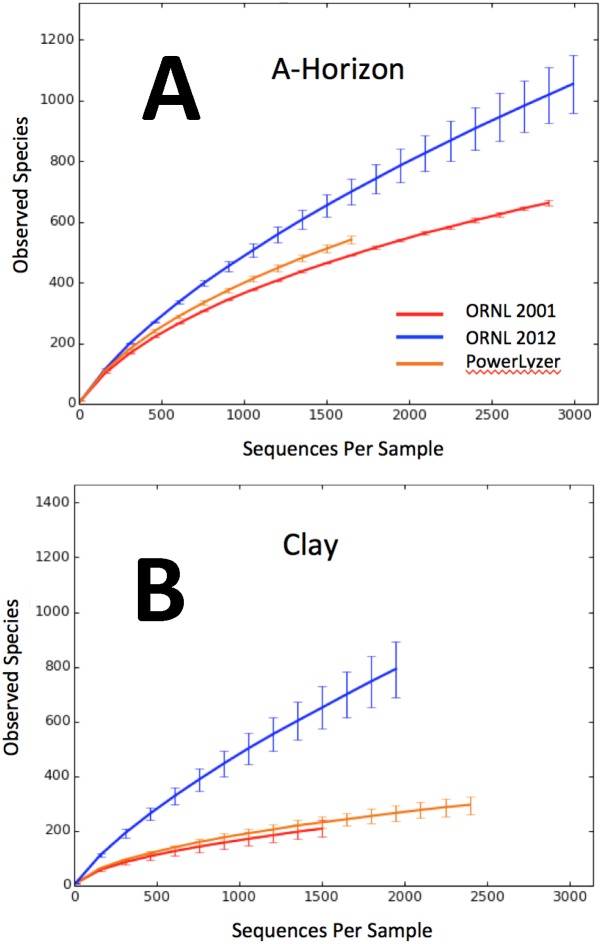
Figure 5. Rarefaction based comparison of Extraction Procedures.
Rarefaction analysis was performed using the de-noised 454 pyrotag sequencing data on de novo picked OTUs for (A) A-horizon and (B) clay samples. Each curve is the average from experimental replicates (N = 2 libraries for the 2001 method and ORNL 2012 method A-horizon samples; N = 3 libraries for the remainder of the sample/method combinations) from 100 jackknife iterations over each sampling depth. The key for the A-horizon comparison of accessed diversity uses the same color code as for the clay sample comparison.

