Abstract
We studied optimization of common-path optical coherence tomography (CP OCT) sensitivity through angled fiber probe. The magnitude of reference power derived from the tip of the fiber was optimized through careful selection of the polishing angle. We experimentally measured the signal-to-noise ratio at different polishing angles to validate the effectiveness of this technique. We also obtained OCT images with the reference optimized CP OCT with more than 10 dB improvement in SNR..
Common-path optical coherence tomography (CP OCT) has been shown to be highly effective in endoscopic imaging and surgical tool guiding due to its simple design, miniature probe dimension, and its disposability, and because the probe can have any arbitrary length [1, 2]. In CP OCT, the reference signal is usually derived from the fiber probe tip. Fresnel reflection at the interface between the fiber and air can provide about 3.4% of the incident light as a reference signal; however, such reference level is not ideal for obtaining optimized OCT images. In an OCT system based on a Michelson interferometer with a separate reference and sample arm, the reference power can be conveniently adjusted by inserting an attenuator into the reference arm. It is challenging, however, to adjust the reference reflectivity of CP OCT that derives reference from the probe tip. It is possible to incorporate a gradient index (GRIN) lens or GRIN fiber in the probe arm to obtain a reference level that results in improved image quality [3, 4]. This adds more interfaces at the probe tip, however, and can introduce image artifacts. In this paper, we study and propose to optimize the reference level in CP OCT through angle polishing a single mode fiber (SMF). To the best of our knowledge, this is a simple and highly effective approach that has not been investigated before.
Many studies have shown improved SNR for Fourier domain OCT (FD OCT) compared to time domain OCT, by considering various noise sources and Fourier domain detection schemes. However, most of the previous models did not fully consider the non-linear response of the detectors to the incident optical power or energy. Such a non-linear response can significantly affect the signal-to-noise ratio SNR of OCT systems, particularly for spectral domain OCT (SD OCT) using CCD or CMOS cameras with low saturation levels at which the detector output signal does not increase linearly with the increasing number of photons. During OCT imaging, the integration time of the camera in SD OCT is typically adjusted so that the reference power takes up a significant portion of the detector’s dynamic range while ensuring that the pixels are not saturated at different sample sites. With a larger reference power, the camera has to be operated with a shorter integration time to avoid sensor saturation. Therefore, the OCT system detects less signal photons and has smaller signal magnitude. This implies that higher reference power does not necessarily lead to higher image SNR, although, theoretically, the sensitivity of an OCT system increases with increasing reference power when operated in the shot-noise-limited regime.
Denoting the reference power detected by the camera as Pr, we can calculate N0, the number of photons corresponding to reference light detected by the camera in the SD OCT system, as shown in Eq. (1) where η is the detector’s quantum efficiency; τ is the camera integration time; h is the Planck constant; ν0 is the central frequency of the optical wave.
| (1) |
On the other hand, to maintain a constant reference level from the reading of the camera in the spectrometer, i.e., a constant value of N0, the camera integration time is adjusted according to the reference power level: τ=N0hν0/(ηPr). Therefore, Ns, the number of signal photons detected due to signal power Ps can be calculated as: Ns=τPs=ηN0(Ps/Pr). Considering only the shot noise for simplicity, the SNR of an OCT image can be calculated with SNR=10log10(S2/σshot2) where S=ητ(PsPr)1/2/(Nhν0) and σ2shot=ητ(Ps+Pr)/(N2hν0) [5, 6]. Here N indicates the number of pixels in the line scan camera. Using Eq. (1), SNR can be further expressed as Eq. (2) which shows that a larger reference power (Pr) does not always lead to a smaller rather than larger SNR.
| (2) |
However, the calculation of SNR shown in Eq. (2) does not consider the autocorrelation noise (ACN) due to the mutual interference of the optical field scattered from all the sample features [7]. ACN appears in the zero-delay region and adds ambiguities when interpreting the OCT image. When the reference power is extremely low and comparable to the sample power in magnitude, the image quality gets degraded by ACN that is not effectively suppressed. Therefore, an optimized reference power should be small enough to allow the system to acquire plenty of signal photons and should be large enough to suppress autocorrelation noise.
Fig. 1a shows a SMF probe with a small polishing angle α (exaggerated for clarity of illustration). Optical wave (E0, the bold, italic letter indicate a complex field vector) propagates in the fiber as the fundamental mode of the fiber and gets refracted (Es) and reflected (Er) at the interface between the fiber and air, assuming air is the medium in which the probe is placed. The amplitudes of Er can be calculated using Fresnel law for s-polarized light because the light field is considered to be in linear polarization (LP mode) in fiber, Er=Rs(α)E0 and Rs(α)=(ncosα−cosαt)/(ncosα+cosαt). Here n is the refractive index of silica and αt is the angle of refraction. For a non-zero polishing angle, only a small fraction (γ0) of the reference light will be detected as reference power Pr as shown in Eq. (3) (c: speed of light in vacuum; ε0: vacuum permittivity), because the reflected optical field does not match the eigenmode of the fiber and different polishing angle results in different degree of mismatch between Er and the eigenmode:
| (3) |
Figure 1.

(a) light reflection at the fiber tip which is polished at angle α; (b) the coupling of reflected light to SMF0 is equivalent to the coupling of light from another fiber SMF1 that is displaced and tilted with regard to SMF0.
In Eq. (3), γ is a coefficient determined by the polishing angle and A stands for the constant values.
The angle polished fiber can be viewed as having two parts: one part is a normal SMF indicated with light grey color in Figure 1a (SMF0); the other part is a wedge, as indicated with dark gray color in Figure 1a. The coupling of Er into SMF0 can be considered as the coupling of optical field from another fiber, which is displaced and tilted relative to SMF0, as denoted with SMF1 in Figure 1b. An overlap integral between modes of SMF0 and SMF1 can be calculated to determine γ0, the coupling efficiency for the reflected reference optical field into SMF0. The value of γ depends on the angle between SMF0 and SMF1, axial and lateral displacements, as denoted by θ, da and dl in Figure 1b, and the dependency was derived in previous literature as shown in Eq. (4) with the first, second, and third term corresponding to fiber tilting, lateral displacement, and axial displacement. [8].
| (4) |
With simple geometric consideration, θ=2α; da=dtan(α)/2 and dl =dtan(2α)tan(α)/2. Here d indicates the mode field diameter of the SMF at wavelength λ; ω0 is the fiber mode field radius at λ and ω0=d/2. According to Eq. (4), γ0 equals to 1 when α=0 and decays with α, suggesting it is possible to obtain an optimized reference power Pr by changing α.
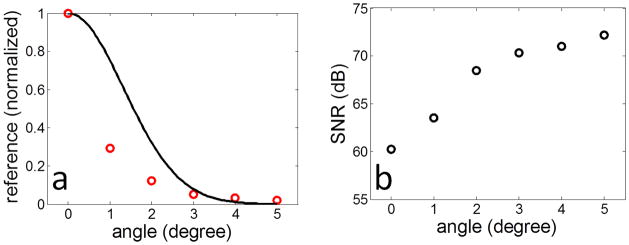
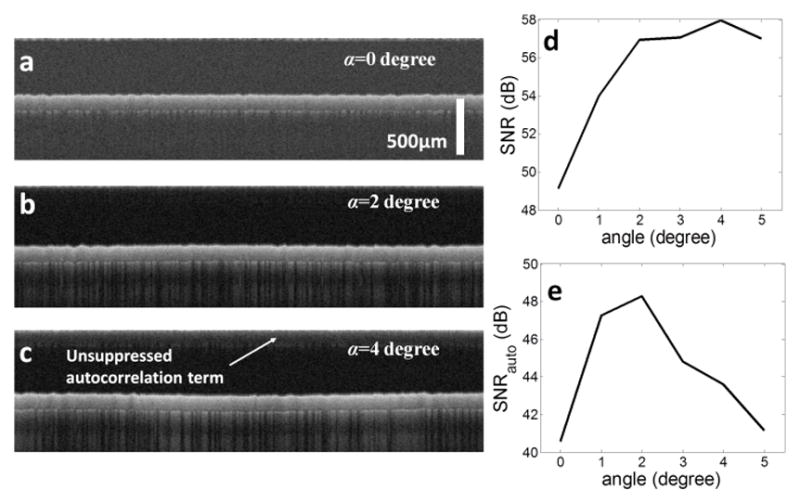
To study the dependency of reference power on polishing angle, we conducted experiments with a spectral domain OCT system using a SLED with central wavelength λ of 840 nm and full-width half-maximum bandwidth of 55 nm. A CCD camera (e2v, AVIIVA EM4) was used in the spectrometer. A SMF with ω0=2.8μm was used as a probe arm. More details of this system can be found in our previous publication [9]. We used a bare optical fiber polisher to polish the SMF tip to different angles to obtain different Pr. The integration time (τ) of the CCD camera was adjusted so that the average reading from the CCD pixels stayed almost the same at different Pr. γ at different polishing angle is calculated with Eq. (3) and (4), normalized to its value when α=0 and shown as the black curve in Figure 2a. On the other hand, Pr and then γ(α) is proportional to the average reading (R) from the pixels of the camera divided by the integration time. As a result, a normalized γ(α) can be calculated γ(α)=[Rr(α)/τ(α)]/[Rr(0)/τ(0)] and the experimentally acquired γ values are shown as red circles in Figure 2a. Red circles in Figure 2a flow the trend of the black curve. The difference between the black curve and the red circles might also be due to several factors, such as the inaccuracy in the angle control of the polisher and the roughness of the polished surface. To experimentally assess the SNR performance for CP OCT probe with different polishing angle α, we imaged a mirror with an axial distance of 1.7 mm away from the fiber tip while the normal of the mirror surface was along with the axial direction of the fiber. A-scans were obtained and SNRs were calculated using SNR=10log10[max(X)2/σ2], where X is the OCT signal and σ2 is the noise variance of OCT signal [10]. SNR at different polishing angle α is shown in Figure 2b. With a polishing angle α equal to or larger than 2 degrees, the SNR has a more than 8dB improvement compared to CP OCT with a SMF probe that has a flat tip. We also obtained M-scan images (each with 2048 A-scans) of the grinding paper when the polishing disk was spinning at the same speed, with different α and identical distance between fiber tip and the grinding paper. To display the images with the same dynamic range (DR) for fair comparison, we normalized the linear OCT images to its maximum value; converted them to logarithm scale using Eq. (5) and displayed them in Figure 3a–c corresponding to α=0, 2°, and 4°.
Figure 2.

(a) normalized reference power at different polishing angle (red circles) and coupling efficiency (black curve); (b) SNR measured from a mirror at different polishing angle
Figure 3.

(a) – (c) M-scan image of spinning grinding paper obtained with probes at different polishing angle. Scale bar in Figure 3(a) applies only to axial direction; (d) SNR VS polishing angle; (e) SNRauto VS polishing angle
| (5) |
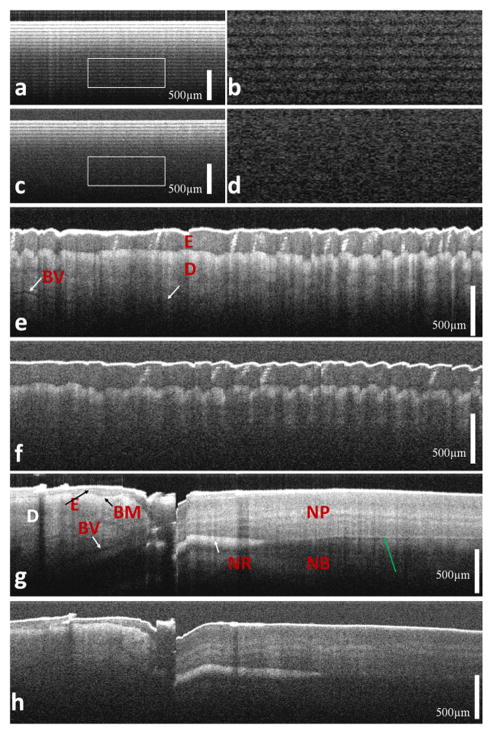
Figure 3b and c show much better SNR performance compared to Figure 3a; however, there is visible autocorrelation noise in Figure 3c, as indicated by the white arrow, due to the small reference power that could not suppress autocorrelation sufficiently. Quantitative assessments of the ratio between signal and noise in a region with a large optical delay (SNR), and the ratio between signal and ACN near-zero delay (SNRauto), are shown in Figure 3(d) and (e). Both SNR increases as α, which is consistent with Eq. (2) and Figure 2(b); however, SNRauto becomes smaller for larger polishing angle. Therefore, to obtain high SNR as well as achieve significant suppression of the autocorrelation noise, we polished the fiber tip to 2 degrees and attached the SMF to a stainless steel tube. We performed manual scan using the probe and corrected the non-uniform scanning speed with the speckle motion tracking method we developed [8]. Images obtained from multiple tape layers, skin of human finger tip, and finger nail near the nail fold region are shown in Figure 4a, Figure 4e and Figure 4g, with the same display dynamic range. We also obtained images using a CP OCT with a flat tip SMF probe and show images obtained from the same samples in Figure 4c, f and h. With the improved SNR from the angle polished SMF probe, Figure 4a shows the tapes with a larger imaging depth compared to that shown in Figure 4c. This is demonstrated more clearly in Figure 4b and d which show areas at the same depth as indicated by the rectangles of Figure 4a and c. Layer structure representing tapes is clearly visible in Figure 4b but not in Figure 4d. Compared to Figure 4f, Figure 4e shows a much stronger signal in the layer of dermis and more structures such as blood vessels in dermis. Similarly, Figure 3g shows a larger signal from the dermis and also the nail plate, compared to Figure 4h. In addition, Figure 4g shows blood vessels as well as a clear boundary between nail plate and nail bed, indicated by the green arrow in Figure 4g, and is not discernible in Figure 4h.
Figure 4.
(a) OCT image of multiple layers of tape obtained from angle polished SMF probe; (b) area enclosed by the rectangle of Figure 3a; (c) OCT image of multiple layers of tape obtained from flat tip SMF probe; (d) area enclosed by the rectangle of Figure 3c; OCT image of human finger tip obtained from angle polished SMF probe (e) and flat tip SMF probe (f); OCT image of human finger nail obtained from angle polished SMF probe (g) and flat tip SMF probe (h). (E: epidermis; D: dermis; BM, basement membrane; BV: blood vessel; NR: nail root; MP: nail plate; NB: nail bed).
In this study, we have demonstrated the optimization of CP OCT image SNR by angle polishing the SMF probe. The enhancement of the image quality mainly comes from changing the ratio between Pr and P, similar to the approach that optimized OCT system based on Michelson interferometer by changing the power-splitting ratio in the sample and reference arms [11]. However, substantial increase in signal at large imaging depth might also come from the fact that the angle polished SMF collects more photons that experience more than one scattering event [12]. The coupling of multiple-scattered, off-axis photon into an angle polished SMF would be our future study.
Footnotes
OCIS Codes: 110.4500,060.2350, 170.2150.
References
- 1.Kang JU, Han J, Liu X, Zhang K, Song C, Gehlbach P. IEEE J Sel Top Quantum Electron. 2010;16(4):781. doi: 10.1109/jstqe.2009.2031597. [DOI] [PMC free article] [PubMed] [Google Scholar]
- 2.McLaughlin RA, Quirk BC, Curatolo A, Kirk RW, Scolaro L, Lorenser D, Robbins PD, Wood BA, Saunders CM, Sampson DD. IEEE J Sel Top Quantum Electron. 2011 [Google Scholar]
- 3.Sharma U, Fried NM, Kang JU. IEEE J Sel Top Quantum Electron. 2005;11(4):799. [Google Scholar]
- 4.Lorenser D, Quirk BC, Auger M, Madore W, Kirk RW, Godbout N, Sampson DD, Boudoux C, McLaughlin RA. Opt Lett. 2013;38:266. doi: 10.1364/OL.38.000266. [DOI] [PubMed] [Google Scholar]
- 5.Leitgeb R, Hitzenberger C, Fercher A. Opt Express. 2003;11:889. doi: 10.1364/oe.11.000889. [DOI] [PubMed] [Google Scholar]
- 6.Liu X, Li X, Kim D, Ilev I, Kang JU. Chin Opt Lett. 2008;6:899. [Google Scholar]
- 7.Seck H, Zhang Y, Soh Y. J Biomed Opt. 2012;17(7):076029. doi: 10.1117/1.JBO.17.7.076029. [DOI] [PubMed] [Google Scholar]
- 8.Cheo Peter K., editor. Fiber optics and optoelectronics. Hartford Graduate Center; [Google Scholar]
- 9.Liu X, Huang Y, Kang JU. Opt Express. 2012;20:16567. [Google Scholar]
- 10.Adler DC, Ko TH, Fujimoto JG. Opt Lett. 2004;29:2878. doi: 10.1364/ol.29.002878. [DOI] [PubMed] [Google Scholar]
- 11.Rollins AM, Izatt JA. Opt Lett. 1999;24:1484. doi: 10.1364/ol.24.001484. [DOI] [PubMed] [Google Scholar]
- 12.Karamata B, Laubscher M, Leutenegger M, Bourquin S, Lasser T, Lambelet P. J Opt Soc Am A. 2005;22:1369. doi: 10.1364/josaa.22.001369. [DOI] [PubMed] [Google Scholar]


