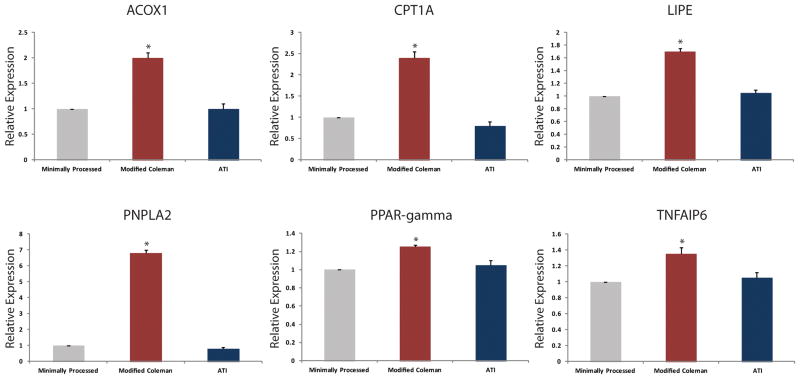
Figure 3.
Quantitative real-time PCR of lipolytic genes. Transcript levels for A) acyl-CoA oxidase 1 (ACOX1), B) carnitine palmitoyltransferase 1A (CPT1A), C) hormone-sensitive lipase (LIPE), D) patatin-like phopholipase domain containing 2 (PNPLA2), E) peroxisome proliferator-activated receptor gamma (PPAR-γ), and F) tumor necrosis factor-alpha induced protein 6 (TNFAIP6) demonstrated significantly increased expression in adipocytes following modified Coleman technique (red) processing compared to adipocytes from the ATI device (blue) or minimally processed (gray) groups (*p < 0.05).

