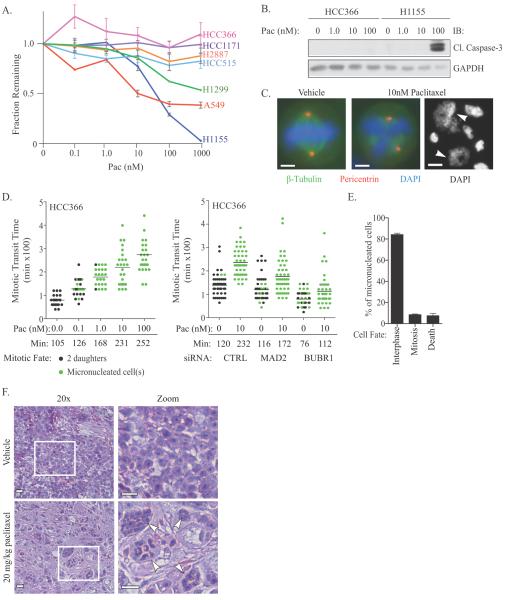
Figure 1.
(A) Paclitaxel dose curves in indicated NSCLC cell lines. Each point is the mean ± Standard Error of the Mean (SEM) for 3 independent experiments. (B) Whole cell lysates (WCLs) from HCC366 and H1155 exposed to paclitaxel for 48 hours were immunoblotted as indicated. (C) Immunostaining of HCC366 cells treated for 24 hours. Arrowheads indicate micronucleated cells. Scale = 5 μm or 15 μm (right panel). (D) Single-cell lineage tracing of HCC366 cells stably expressing GFP-H2B (HCC366-GFP-H2B) for 48 hours post-paclitaxel exposure. Each circle represents a single cell. Bar is mean mitotic transit time, which is also indicated. Right panel: Cells were transfected with indicated siRNAs for 48 hours prior to drug exposure. (E) Quantitation of single-cell lineage tracing of HCC366-GFP-H2B micronucleates post exposure to 10 nM paclitaxel. Bars represent mean ± range for 100 cells over 2 experiments. (F) H&E staining of HCC366 subcutaneous tumor xenografts treated as indicated. Arrowheads specify micronucleated cells. Scale = 40 μm. Zoomed images are of white boxed area.

