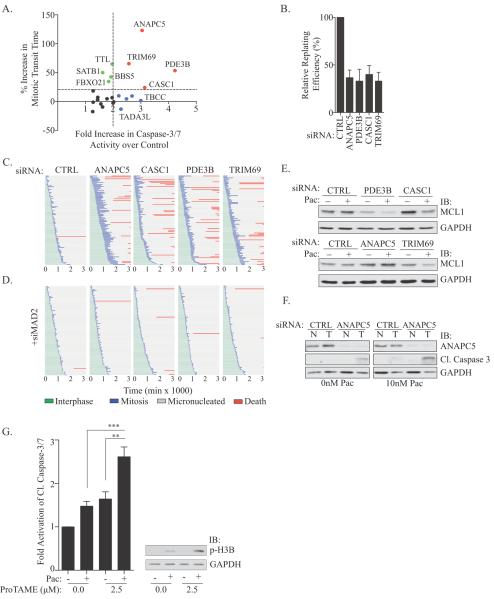
Figure 2.
(A) Graph of relative mitotic transit time (y) vs. relative caspase-3/7 activity (APO-ONE®) in HCC366 cells exposed to paclitaxel. A subset of siRNA gene targets is indicated. (B) Colony formation assay in HCC366s exposed to 10 nM paclitaxel for 48 hours. Bars represent mean ± SEM from n=3 independent experiments. (C) HCC366-GFP-H2B cells were transfected with indicated siRNAs for 48 hours followed by exposure to 10 nM paclitaxel. Live cell imaging commenced with paclitaxel treatment and single-cell lineage traces of 50 cells from 2 independent experiments were measured. (D) As in C, but in the presence of siMAD2. (E) WCLs from HCC366 cells transfected for 48 hours followed by exposure to vehicle or 10 nM paclitaxel for 48 hours were immunoblotted with indicated antibodies. (F) WCLs from non-tumorigenic HBEC3KT (N) and HCC366 (T) cells treated as in 2E were immunoblotted with indicated antibodies. (G) Left panel: Relative cleaved caspase-3/7 activity (APO-ONE®) in HCC366s treated with vehicle, 10 nM paclitaxel or 2.5 μM proTAME for 24 hours. Bars represent mean ± SEM for n=9 independent experiments. ** P <0.01 *** P < 0.0001 (unpaired two-tailed student's t-test). Right panel: Immunoblot of WCLs of HCC366s treated as in left panel.

