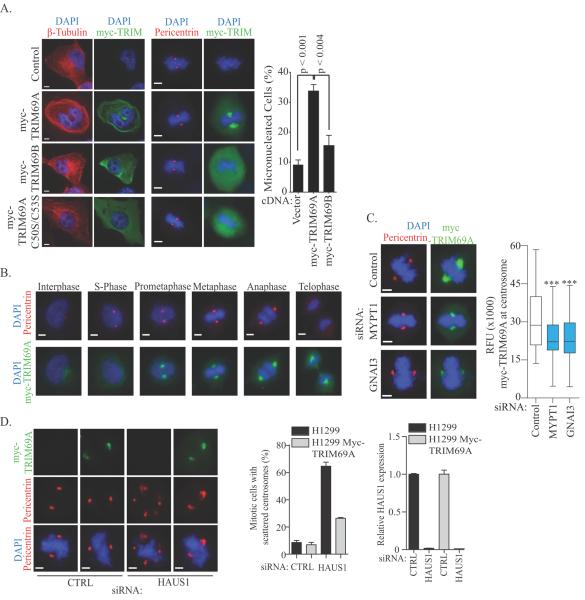
Figure 5.
(A) HeLa cells transfected with indicated cDNAs for 48 hours were fixed and immunostained. Scale = 5μm. Right panel: Quantitation of cells from (A). Bars represent mean ± range for n=2 independent experiments. (B) Immunostaining of H1299-myc-TRIM69A representing each stage in the cell cycle based on nuclear morphology. Scale bar = 5 μm. (C) H1299 cells stably expressing myc-TRIM69A were transfected with indicated siRNA for 72 hours and immunostained with indicated antibodies. Plots represent relative fluorescence of myc-TRIM69A at centrosomes in > 150 cells across 3 independent experiments. *** P <0.0001 by two-tailed Mann Whitney test. Scale = 5 μm. (D) Left panel: H1299 cells were immunostained with indicated antibodies following siRNA transfection for 72 hours. Scale = 5 μm. Middle panel: Quantitation of cells from (D). Bars represent mean ± range from 2 independent experiments. Right panel: Bars represent mean mRNA expression levels of HAUS1 72 hours post-transfection.

