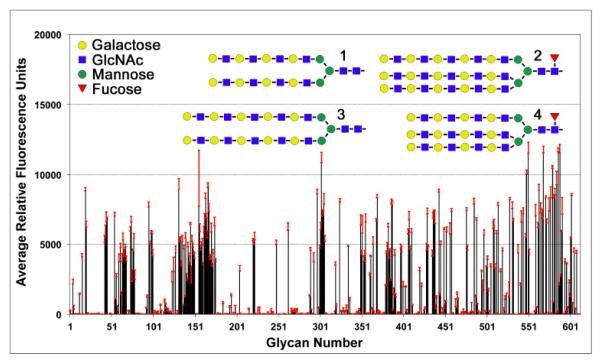
Figure 2. Glycan array data.
VVH displays a broad glycan recognition profile with a preference for terminal LacNAc groups. Labeled VVH lectin (50 μg/ml) was screened against a panel of 610 mammalian-derived carbohydrate ligands by the Consortium for Functional Glycomics with six replicates. Data are presented as the average relative fluorescence units and errors bars (in red) denote the standard deviation from four replicates (after dropping the highest and lowest of six measurements). Schematic representations of the top four glycans identified in the screen are shown above the chart data. Additional analysis of these results is provided in Table 1.

