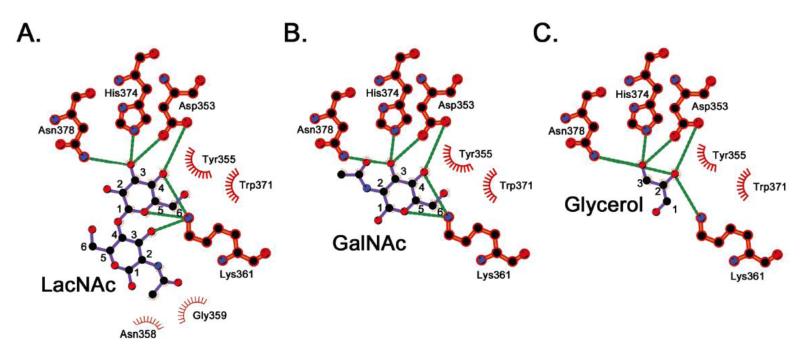
Figure 4. Specific ligand interactions.
Schematic representations of interactions between residues in the binding site and the three ligands are shown in (A), (B), and (C) for LacNAc, GalNAc, and glycerol, respectively. Hydrogen bonds are shown as green dotted lines and nonbonded interactions are denoted by spoked arcs. Carbon atoms are numbered for comparison. Images were generated using LigPlot+ v.1.4.5 51.

