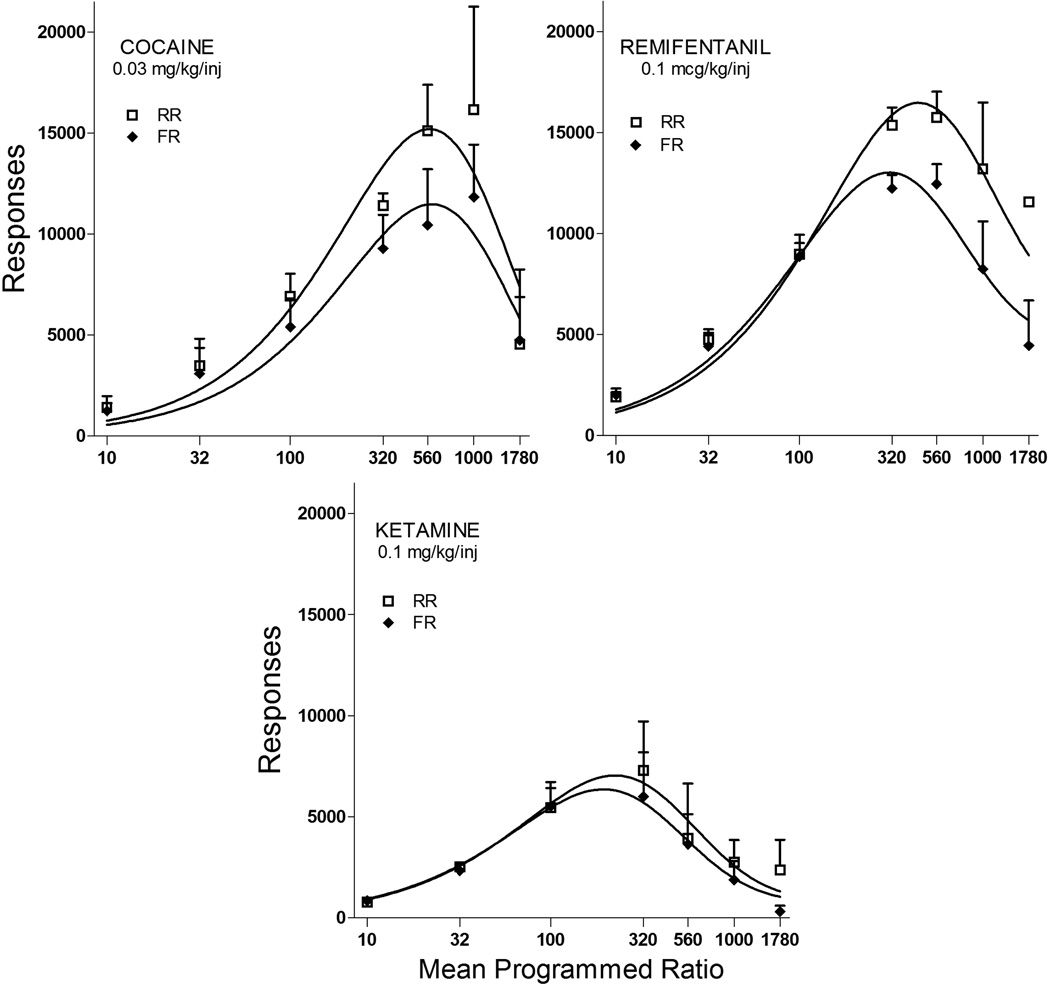
Fig. 2.
Comparison of responses produced by random (open symbols) and fixed (closed symbols) ratio schedules as a function of the average programmed ratio requirement across the three drugs. Curves are fit to the data based on Equation 5. Error bars display the standard error across subjects

