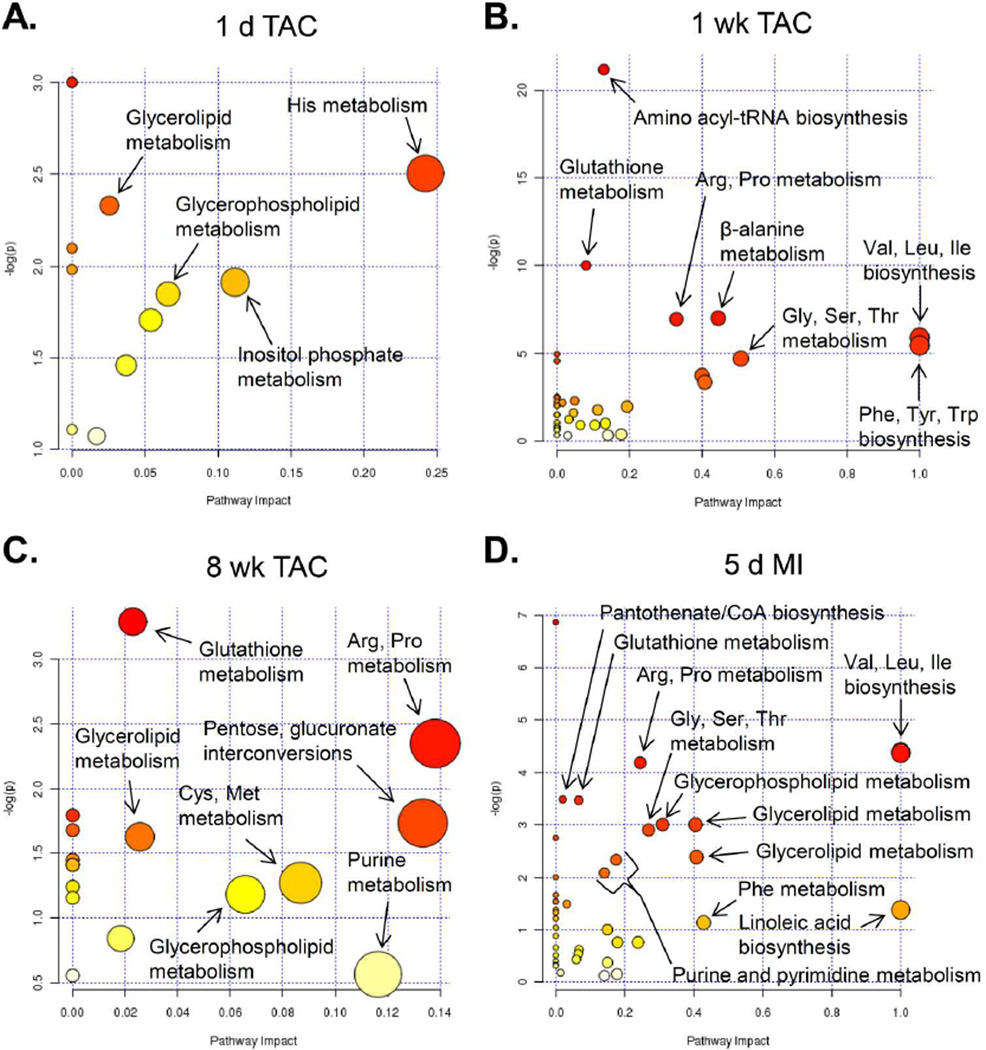
Figure 6. Pathway impact analysis of metabolic changes.
Metabolites showing significant changes were analyzed using Metaboanalyst MetPA and the Mus musculus pathway library: (A) 1 d; (B) 1 week; and (C) 8 weeks of TAC; and (D) 5 d of MI. Fisher’s exact test was used for overrepresentation analysis, and relative between-ness centrality was used for pathway topology analysis; n = 5 per group.

