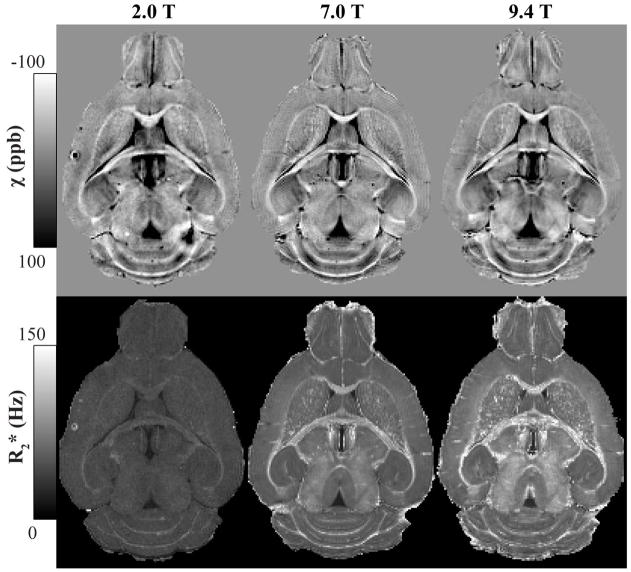
Figure 1.
Processed image data representing magnetic susceptibility (top row) and R2* (bottom row) for the mouse brain specimen perfused with 40 mM Gd-HP-DO3A solution and scanned at 2.0, 7.0 and 9.4 T. Image resolution is 3-D isotropic at 86 μm. The intensity scale of the susceptibility maps was inverted to represent diamagnetic regions (such as WM) with bright pixels and paramagnetic regions (such as the Gd-filled ventricles) as dark pixels. Both image contrasts clearly delineate white matter regions at this Gd concentration.

