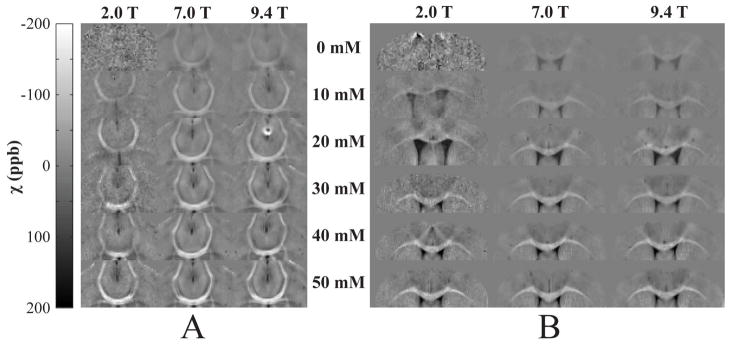
Figure 2.

Apparent magnetic susceptibility maps detailing two white matter brain regions: the A) anterior commissure and B) corpus callosum. Each row represents an individual specimen perfused with one of six concentrations of contrast agent, and each column corresponds to one of the three magnetic field strengths at which the specimens were scanned. White-gray matter susceptibility contrast is significantly enhanced as a function of Gd concentration and is field invariant.
