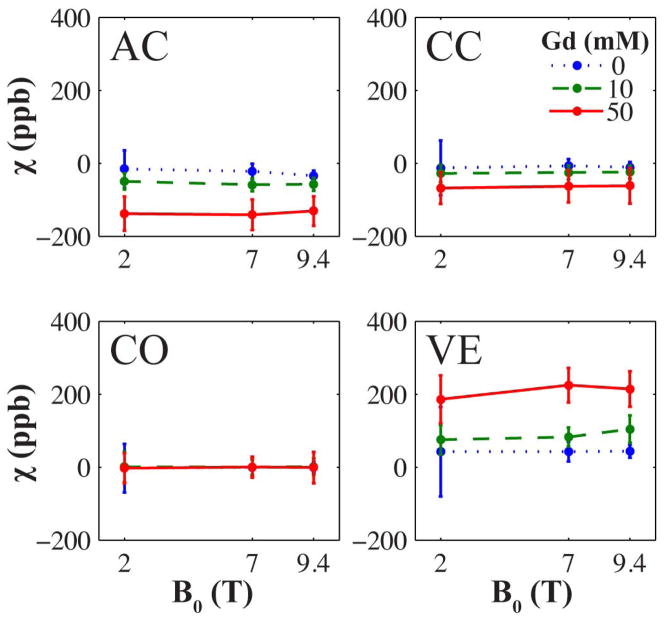
Figure 3.
Mean apparent magnetic susceptibility as a function of magnetic field strength in mouse specimens perfused with three different concentrations of Gd contrast agent (0, 10, and 50 mM). The brain regions shown are the anterior commissure white matter (AC), corpus callosum white matter (CC), cortical gray matter (CO), and ventricles (VE). Error bars represent the standard deviation. The empirical field invariance shown here agrees with magnetic susceptibility imaging theory. Magnetic susceptibility in the cortex appears unaffected by Gd concentration because the radiofrequency pulse is tuned to the frequency of brain specimens composed of mostly gray matter.

