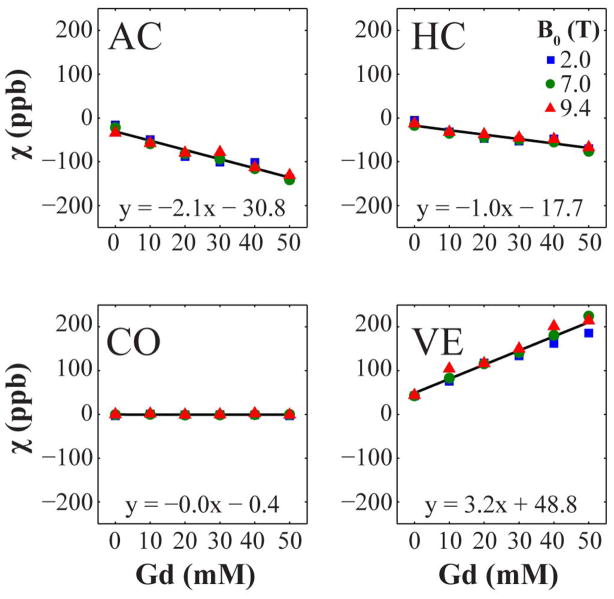
Figure 5.
Region-wide mean apparent magnetic susceptibility as a function of Gd concentration at 2.0, 7.0, and 9.4 T. The brain regions shown are the anterior commissure white matter (AC), corpus callosum white matter (CC), cortical gray matter (CO), and ventricles (VE). The error bars have been omitted for clarity. The best-fit line and equation were created using least-squares regression on the combined data from all three field strengths. The apparently linear relationship in WM may be the result of averaging susceptibility values from all voxels in each tissue structure regardless of white matter fiber orientation.

