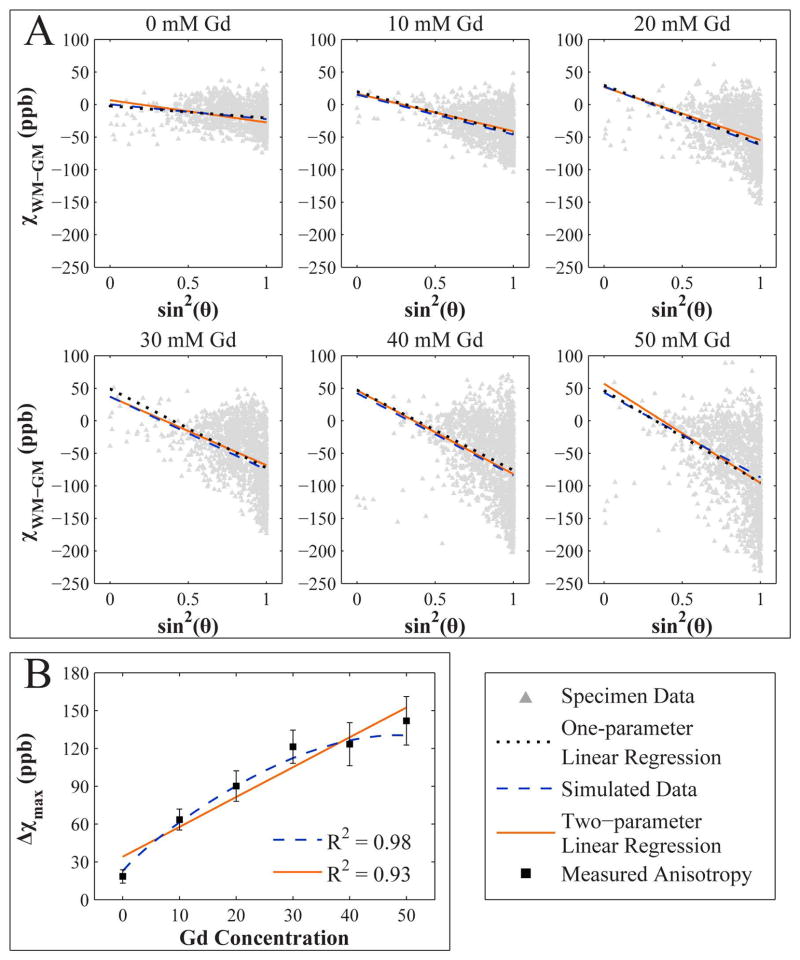
Figure 6.
A) WM-GM susceptibility contrast dependence on white matter fiber orientation and Gd concentration at 7.0 T in the anterior commissure. Field-parallel fibers are sparsely represented in the image data due to the scan orientation of the specimens. For each specimen, one-parameter linear regression was used to find the mean susceptibility contrast as a function WM fiber orientation only. A two-parameter regression model was used to find mean susceptibility contrast as a function of both fiber orientation and Gd concentration. The simulated data was generated from the three-pool WM fiber model. B) WM susceptibility anisotropy as a function of Gd concentration in the anterior commissure. Susceptibility anisotropy is increased by more than six-fold at the highest Gd concentration used in this study. Both models are highly correlated with the measured anisotropy.

