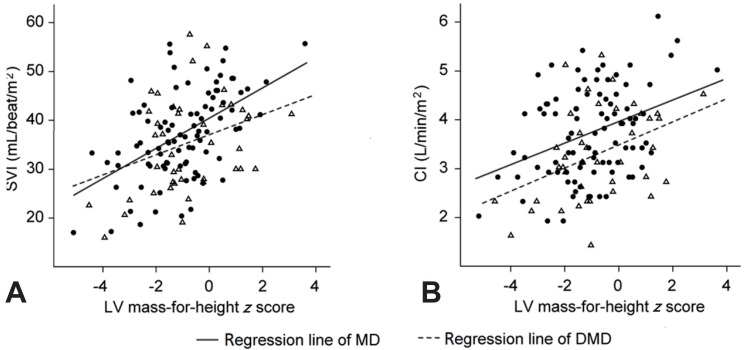
Fig. 2.
The distributions of the stroke volume index (SVI) (A) and cardiac index (CI) (B) according to the left ventricular (LV) mass-for-height z scores correlate significantly in patients with MD or DMD. The straight and dotted lines represent the regression lines for patients with MD and DMD, respectively. MD, mitochondrial disease; DMD, Duchenne muscular dystrophy.

