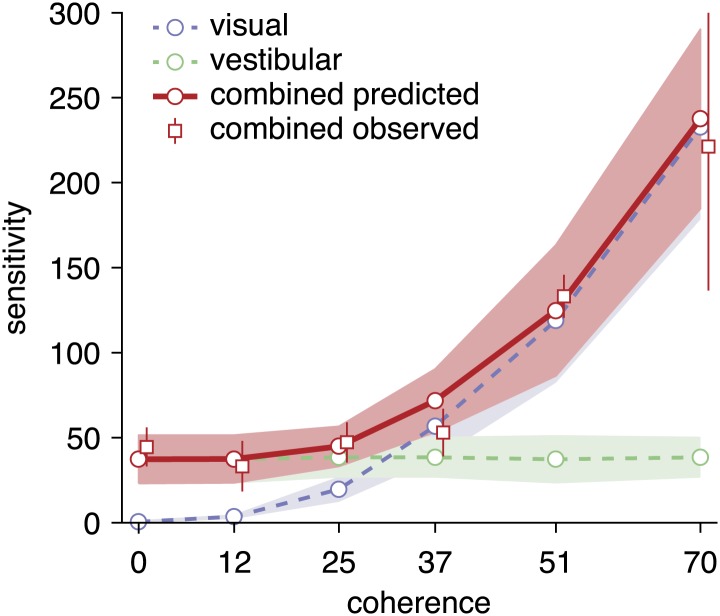
Figure 6. Predicted and observed sensitivity in the combined condition.
The sensitivity parameter measures how sensitive subjects are to a change of heading. The solid red line shows predicted sensitivity for the combined condition, as computed from the sensitivities of the unimodal conditions (dashed lines). The combined sensitivity measured by fitting the model to each coherence separately (red squares) does not differ significantly from the optimal prediction, providing strong support to the hypothesis that subjects accumulate evidence near-optimally across time and cues. Data are averaged across datasets (except 0%, 12%, 51% coherence: only datasets B2, D2, F2), with shaded areas and error bars showing the 95% CIs.

