Fig. 2.

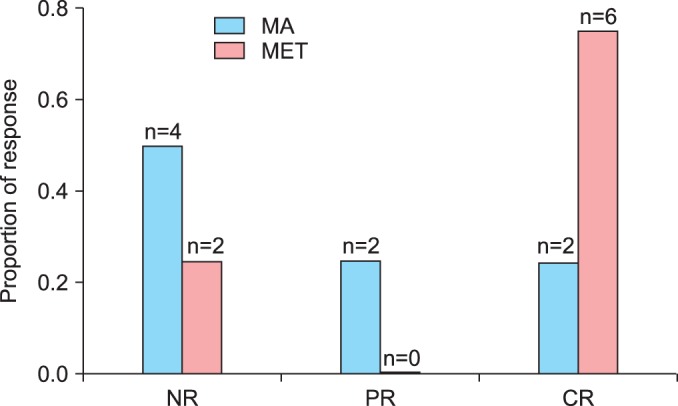
Response distribution in the megestrol acetate (MA) and metformin plus MA (MET) groups in the study. Response distribution was compared between the two groups (p=0.105). CR, complete response; NR, no response; PR, partial response.

Response distribution in the megestrol acetate (MA) and metformin plus MA (MET) groups in the study. Response distribution was compared between the two groups (p=0.105). CR, complete response; NR, no response; PR, partial response.