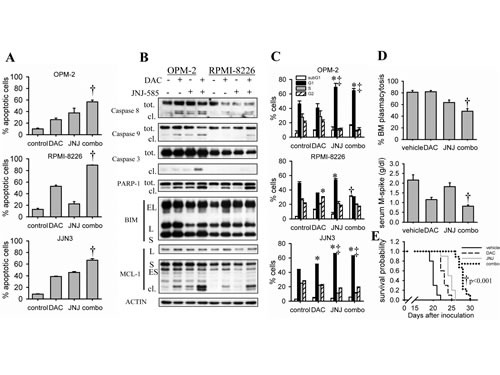
Figure 4. JNJ-585 enhances decitabine-mediated anti-MM effects.

A-C: Cells were treated with decitabine (DAC) and/or JNJ-585 for 3 days (2 days for JJN3) (A) or 2 days (1 day for JJN3) (B, C). Doses used for OPM-2 were 1µM decitabine and 2.5nM JNJ-585; for RPMI-8226 1µM decitabine and 5nM JNJ-585; for JJN3 0.5µM decitabine and 10nM JNJ-585. A: Apoptosis was determined by flow cytometry using AnnexinV-FITC/7'AAD staining. Apoptotic cell percentage is the sum of annexinV+ and AnnexinV+/7'AAD+ cell percentage. Bars and error bars are mean ± SD of 3 experiments. B: Total protein lysates were subjected to western blot analysis for the expression of caspase-9, -8, -3, PARP-1, BIM and MCL-1. ACTIN was used as loading control. C: Samples were stained with PI and cell cycle profiles based on DNA content were obtained by flow cytometry. Bars and error bars are mean ± SD of 3 experiments. D: C57BL/KaLwRij mice were inoculated with 5T33MM cells and treated from day 1. The experiment was terminated upon first signs of morbidity of the mice. Treatment groups were vehicle (n=9), 0.2mpk decitabine (n=9), 1.5mpk JNJ-585 (n=9) or the combination (n=9). After sacrification, BM from hind legs was isolated. Cytospins were stained with May Grünwald-Giemsa and BM plasmacytosis was quantified by manual counting. Total blood was collected and the serum M-spike was measured using serum electrophoresis. E: Mice were treated 1 day after inoculation with purified 5T33MM cells. Treatment groups were as follows: vehicle (n=10), 0.2mpk decitabine (n=10), 1.5mpk JNJ-585 (n=10) and the combination (n=9). Mice were sacrified individually when showing signs of morbidity. Kaplan-Meier curves were constructed and significance was evaluated by a log-rank test. * indicates p<0.05 compared to control. ‡ indicates p<0.05 compared to decitabine. † indicates p<0.05 vs. single agents.
