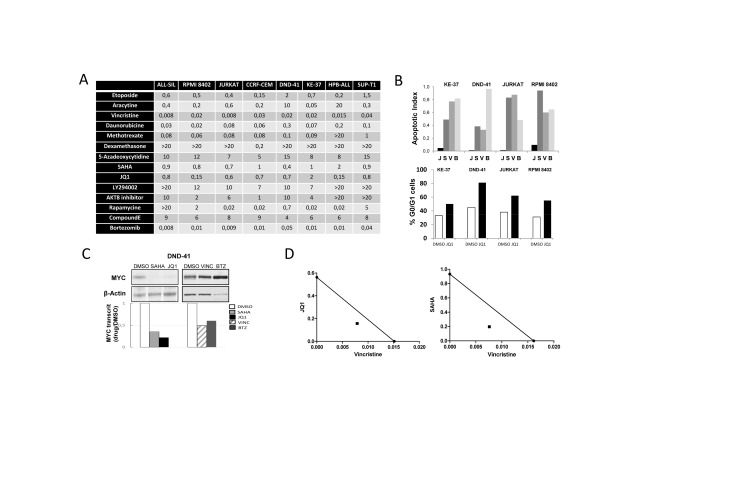
Figure 1. Ex vivo evaluation of drug treatments.
(A) Drug screening. EC50 are reported in µM. (B) T-ALL cell lines were incubated for 48H with 1µM JQ1 (J), 1µM SAHA (S), 50 nM Vincristine (V), 10 nM Bortezomib (B) or the vehicle DMSO, and cellular/molecular analysis were performed. Top: cell apoptosis was monitored by FACS using Annexin V/7-AAD labelling; histograms report the ratio of apoptotic cells treated with drugs versus DMSO. Bottom: cell cycle analysis of T-ALL cell lines treated with JQ1 or DMSO. Cells were labelled with BrdU and 7-AAD, and analyzed by FACS; histograms report the percentage of cells in G0/G1 phase (see Supplemental Fig. S2 for FACS dot plots); (C) Protein extracts and cDNAs were prepared from drug-treated DND41 cells to analyze MYC protein levels by western blot and MYC transcript levels by RQ-PCR. Transcripts are reported as the ratio of MYC transcripts (relative to ABL) from drug-treated cells versus control (for other cell lines see Supplemental Fig. S3). (D) Isobologram representations of the effect of drug combinations Vincristine+JQ1 or Vincristine+SAHA on DND-41 cells viability.

