
Fig 1. S100A4-RAGE interaction leads to release of sRAGE and increased cellular motility of the CRC cell line HCT116.
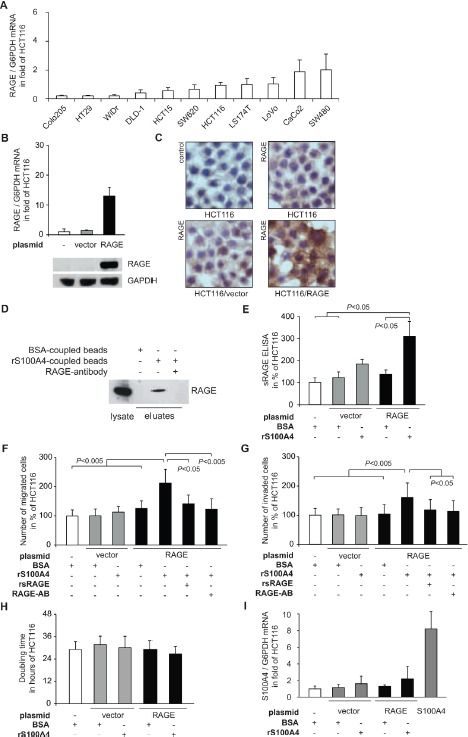
A) RAGE mRNA expression levels in a panel of CRC cell lines, determined by qRT-PCR. Data represent mean RAGE/G6PDH mRNA ratios ± SD. Results were normalized to HCT116 cells. B) Generation of HCT116/RAGE cells clones. HCT116 cells were transfected with either a RAGE expression plasmid (black bars) or the empty control vector (grey bars). Data represent mean RAGE/G6PDH mRNA ratios ± SD. Results were normalized to untreated HCT116 cells. For Western blot analyses, equal loading was confirmed by GAPDH protein detection. C) Immuncytochemistry staining of HCT116, HCT116/vector, and HCT116/RAGE with RAGE-specific antibodies. Nuclei were stained with haematoxylin. D) Interaction of S100A4 and RAGE. Total lysate of HCT116/RAGE cells (lane 1) was incubated with magnetic beads, coupled with BSA (lane 2), or human rS100A4 (lanes 3,4). RAGE-specific antibody was added to an aliquot of the lysate, prior to bead incubation (lane 4). Bead eluates were blotted and incubated with anti-RAGE antibodies. E) Release of sRAGE upon rS100A4 binding. Supernatants of HCT116, HCT116/vector, and HCT116/RAGE cells were subjected to an ELISA for human sRAGE after 24 hours incubation with BSA or rS100A4. The results were normalized to untreated HCT116 cells. Data represent mean values ± SD. F,G) Cell migration (F) and cell invasion (G) of HCT116, HCT116/vector, and HCT116/RAGE after treatment with BSA or rS100A4. The interaction of S100A4 and RAGE was blocked by supplementing either rsRAGE or RAGE-specific antibody. Numbers of migrated and invaded cells were normalized to untreated HCT116 cells, respectively. Data represent mean values ± SD. H) Doubling times of HCT116, HCT116/vector and HCT116/RAGE cells were determined by MTT assays. Data represent mean values ± SD. I) S100A4 mRNA expression levels of HCT116, HCT116/vector, HCT116/RAGE, after treatment with BSA or rS100A4. HCT116/S100A4 cells serve as positive control. Data represent mean S100A4/G6PDH mRNA ratios ± SD. Results were normalized to HCT116 cells.