
Figure 3. HMGA1 knockdown effects on apoptosis in CTSCs.
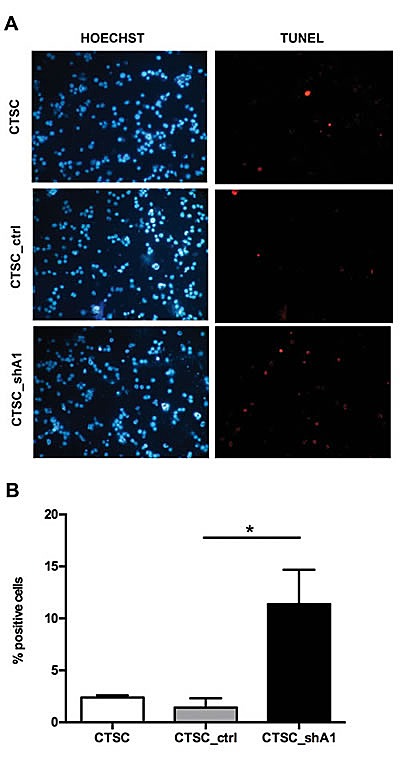
A) Fluorescence micrographs of TUNEL assays performed on non-transfected CTSCs (CTSC), CTSC_ctrl and CTSC_shA1 cells, double-stained with Hoechst dye (left) to identify total nuclei and with TMR red UTP (right) to identify apoptotic, TUNEL-positive cells. B) Bar chart representation of the number of TUNEL-positive cells per 100 Hoechst-positive nuclei in the samples shown in A. Each bar represents the mean ± SD of 10 arbitrary fields. An asterisk indicates the significance of the difference between CTSC_shA1 and CTSC_ctrl (*, p = 0.0014; Kruskal-Wallis test followed by Dunn's post-hoc test).