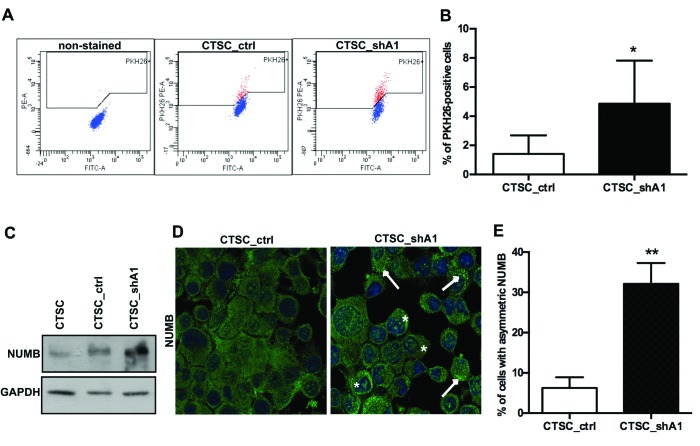
Figure 5. HMGA1 knockdown induces stem cell quiescence and asymmetric Numb distribution.
A) FACS plots of double-coloured (PKH26-phycoerythrin [PE] and fluorescein isothiocyanate [FITC-A]) CTSC_ctrl and CTSC_shA1 cells (one representative experiment). The left-most panel shows cells non-stained with PKH26, gated on physical parameters (forward scatter [FSC] and side scatter [SSC]) to exclude most of the debris and dead cells. B) Mean percentage of PKH26bright cells in CTSC_ctrl and CTSC_shA1 populations, after 10 days from staining. Each bar represents the mean ± SD of 5 independent experiments (*, p < 0,05; Mann-Whitney U-test).C) Western blot for Numb in non-transfected, CTSC_ctrl and CTSC_shA1 cells. GAPDH was used as a loading control D) Immunofluorescence for Numb in CTSC_ctrl (left) and CTSC_shA1 (right) cells. The nuclei are stained in blue with DAPI. Arrows denote the crescent-shaped Numb distribution, whereas asterisks indicate nuclear-localised Numb. The histogram shows the percentage of cells with crescent-shaped, asymmetric Numb distribution, obtained in immunofluorescence analyses, as in C). Data are the mean value ± SD of 7 arbitrary fields for each sample. (** , p = 0.0048; Mann-Whitney U-test).

