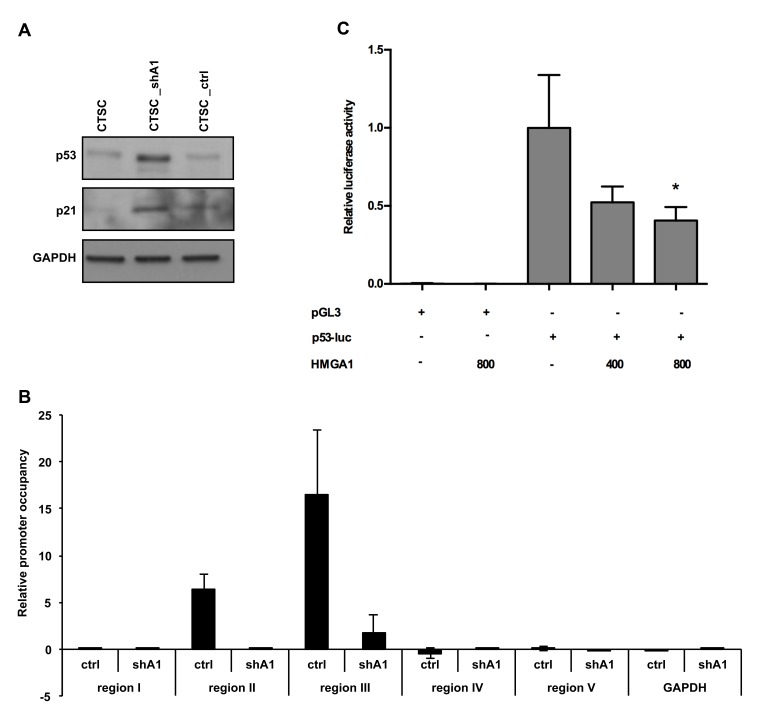
Figure 6. HMGA1 negatively regulates p53 expression at the transcriptional level.
A) Western blot analysis for p53 (upper panel) and p21 (middle panel) expression in non-transfected, HMGA1-knockdown, and scramble-transfected cells. GAPDH was used as a loading control. B) ChIP assay, detecting the in vivo binding of HMGA1 to the 5 sub-regions in the p53 promoter in CTSC_ctrl and CTSC_shA1 extracts. The relative occupancy of the p53 promoter regions by HMGA1 is indicated as vertical bars. GAPDH promoter amplicon was used as a negative control C) Luciferase activity of the p53 promoter in HEK293 cells in the presence or absence of an HMGA1-expressing vector. The amounts of the HMGA1-expressing vector are indicated. The data are the results of three independent experiments performed in duplicate. The relative luciferase activity was normalised with Renilla luciferase and was expressed as the fold induction over the activity of the p53 promoter (*, p < 0.05). pGL3-basic activity in the presence or absence of the HMGA1-expressing construct was used as a negative control.

