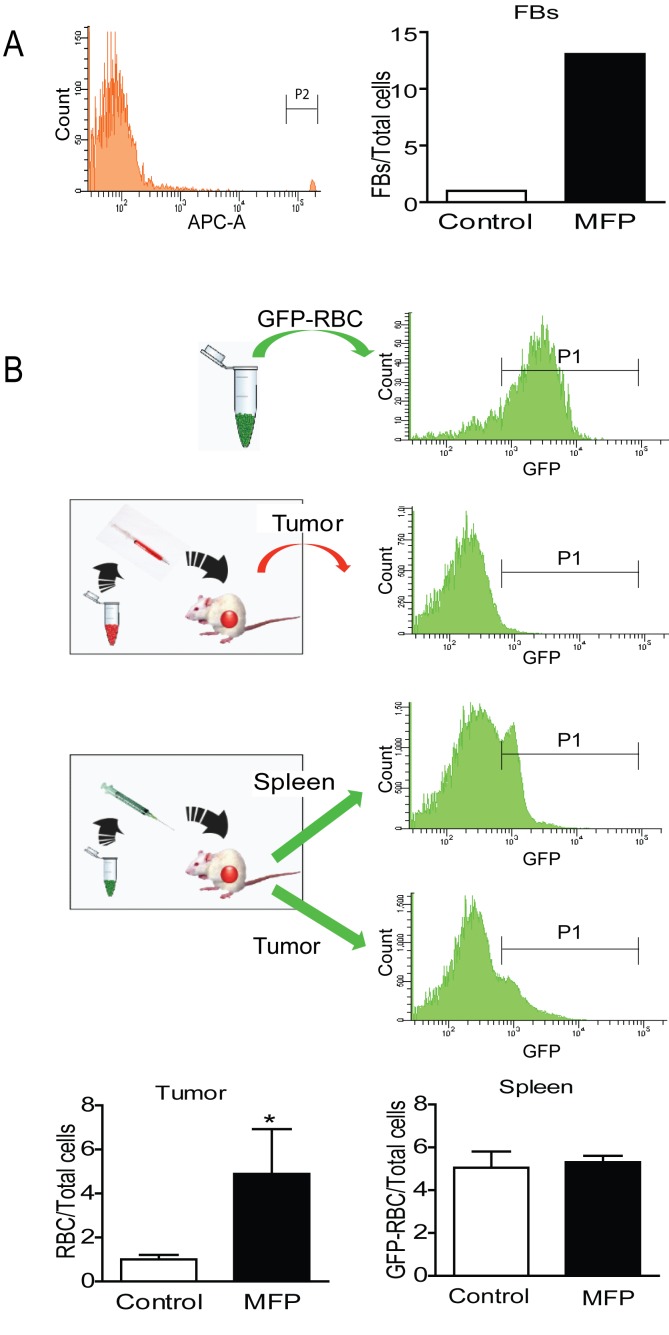
Figure 10. MFP increased the amounts of FB or GFP-RBC in tumors with higher levels of PRA than PRB.
A. FACS analysis of FB injected iv in MFP-treated tumors and untreated mice bearing 59-2-HI tumors. Sixty minutes later mice were euthanized and tumors processed for FACS analysis. An increase in FB was observed in MFP-treated tumors. B, FACS analysis of GFPRBC injected as in A. GFP-RBC were prepared as described in Materials and Methods and were inoculated iv in MFP-treated or untreated tumor bearing mice. Top panel: FACS analysis of GFP-RBC (positive control) and middle panel negative control. Bottom panels: the content of GFP-RBC was evaluated after 3 days by FACS analysis in tumor tissue or in spleens. An increase of GFP-RBC was observed in tumors and not in spleens from MFP-treated mice as compared with untreated mice. *: p<0.05; **: p<0.01 and ***: p<0.001. Frequency corresponds to the number of GFP-RCB (P1) gated on the erythrocyte population in the FAC-A vs. the SSC-A dot plot.

